1

I have some data that I plotted with Python but now I want to erase the plots but not the figure itself.

I have some thing like this :

import numpy as np
import pylab as plt

a = np.array([1,2,3,4,5,6,7,8,9,10])
b = np.array([1,2,3,4,5,6,7,8,9,10])
c = plt.plot(a,b,'r.')

So to clear this I tried this :

a = np.array([])
b = np.array([])
c = plt.plot(a,b,'r.')

but it does not work. What is the best way to accomplish this?
eyllanesc
  • 235,170
  • 19
  • 170
  • 241
  • 1
    Possible duplicate of [When to use cla(), clf() or close() for clearing a plot in matplotlib?](http://stackoverflow.com/questions/8213522/when-to-use-cla-clf-or-close-for-clearing-a-plot-in-matplotlib) – languitar Mar 22 '17 at 15:16
  • This question is different from the earlier questions: it asks how to delete (remove) just the 'c' object in c = plt.plot(..). Clearing with cla or clf is far more sweeping. The answer is provided below by @suever. – P2000 Sep 25 '22 at 16:44

3 Answers3

3

You can use the remove method of the returned plot object. This is true of any plot object that inherits from Artist.

c = plt.plot(a,b,'r.')

for handle in c:
    handle.remove()
Suever
  • 64,497
  • 14
  • 82
  • 101
  • if anyone was trying do something like c.remove(), this is the way to do it. The axes and figure (plus titles, grid, other plots etc..) all remain, just the specified plot is removed. – P2000 Sep 25 '22 at 16:40
0

From here:

When to use cla(), clf() or close() for clearing a plot in matplotlib?

plt.cla() clears an axis, i.e. the currently active axis in the current figure. It leaves the other axes untouched.

plt.clf() clears the entire current figure with all its axes, but leaves the window opened, such that it may be reused for other plots.

plt.close() closes a window, which will be the current window, if not specified otherwise.

Also if you prefer doing it line by line, you can remove them like this even if you've lost original references:

for l in ax.get_lines():
    xval = l.get_xdata()[0]
    if (xval == my_criteria):
        l.remove()

or for all, simply:

for l in ax.get_lines():
            l.remove()

likewise you can do the same indexing by y values.

Community
  • 1
  • 1
litepresence
  • 3,109
  • 1
  • 27
  • 35
0

To have axes with the same values of your a, b arrays, you can do:

import matplotlib.pyplot as plt
plt.clf() # To clear the figure.
plt.axis([1,10,1,10])

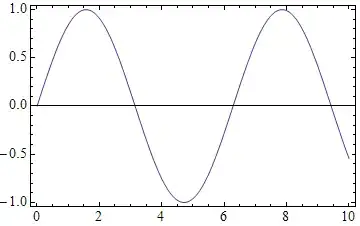
enter image description here

MaiaraSC
  • 11
  • 3