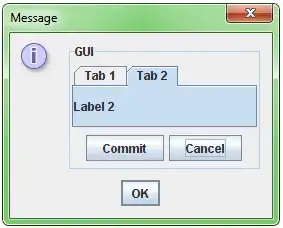
Debugging an ASP.NET MVC application with the default Chrome browser was working fine. I switched the debug over to start up IE instead to do some additional testing and the debugging worked fine. After I was done with IE I switched back to Chrome and now I get this error. If I switch back to IE I also get this error. I have closed and re-opened solution. I have closed and reopened VS. I have run VS with logging and I get no errors in the Activity Log. I can successfully debug if I turn off "Enable JavaScript debugging for ASP.NET" in the debugging options, but it was working fine with that option earlier. Any suggestions?
Asked
Active
Viewed 1.0k times
9
-
What`s the version of your Visual Studio 2017? Have you start Visual Studio 2017 as Administrator and try to create a new ASP.NET MVC application to verify this issue? – Leo Liu Mar 23 '17 at 10:56
-
Version is 4.6.01586. I just created a new web project and attempted to debug and got the same error. Thanks for the help. – RichardWill.Net Mar 23 '17 at 13:57
-
Thanks for you reply. We could not reproduce this issue, so it's hard to provide you an answer. Could you please try to repair or reinstall you VS? If it works fine? – Leo Liu Mar 24 '17 at 10:45
-
Thank you for the suggestion. After the repair, browser link is working again in Chrome. I have not switched over to IE to try it yet. – RichardWill.Net Mar 27 '17 at 12:43
-
@RichardWill.Net, maybe it was the VS setup issue, how about the result if you use the IE now? If it was resolved, you could post the comment as the answer. Have a nice day. – Jack Zhai Mar 30 '17 at 06:13
3 Answers
19
Go to Tools > Options > Debugging > General and turn off the setting for Enable JavaScript Debugging for ASP.NET (Chrome and IE).
Ellix4u
- 566
- 5
- 9
-
@ElvinMammadov. share your error message here. Can i get the full screenshot/details of what you are try to do? – Ellix4u Dec 14 '18 at 11:00
8
I have also encountered this issue on visual studio 2017 like below:
I have followed below step:
Go to Tools > Options > Debugging > General > Unchecked Enable JavaScript Debugging for ASP.NET (Chrome, Edge and IE).
Once I get rid of check box on Enable JavaScript Debugging for ASP.NET (Chrome, Edge and IE)
Then It works for me and Invalid Pointer error gone!
Md Farid Uddin Kiron
- 16,817
- 3
- 17
- 43
0
Unfortunately information on how the debugging emulator works is hard to come by. The only known solutions are...
- Reinstall Visual Studio
- Update Visual Studio if there is a patch/update available.
You can use a different browser or the internal browser.
Jason Geiger
- 1,912
- 18
- 32
-
1Using Edge fixed it for me. Easy to test how it looks in others, once you get one browser up, just copy paste the url into other browsers. – jjxtra Nov 27 '17 at 01:13
-
@jjxtra That is a workaround, not a fix. When you're nose is to the grindstone and you need to get the work done a workaround will do but it should really have a fix. Unfortunately reinstall/patch is currently the only known fix. – Jason Geiger Nov 27 '17 at 15:14
-
-
1@badazzhindu This is not a workaround. The answer below is a workaround. You shouldn't have to disable a feature to get core functionality to work. Reinstalling is a pain but it was necessary in this case. – Jason Geiger Nov 08 '18 at 18:33

