I am trying to build a dashboard to display many graphs using CanvasJS. Each graph will have a button to expand that particular graph to a popup modal. I am doing this by finding the ancestor div of the button and then cloning the relevant child to the modal using jQuery.
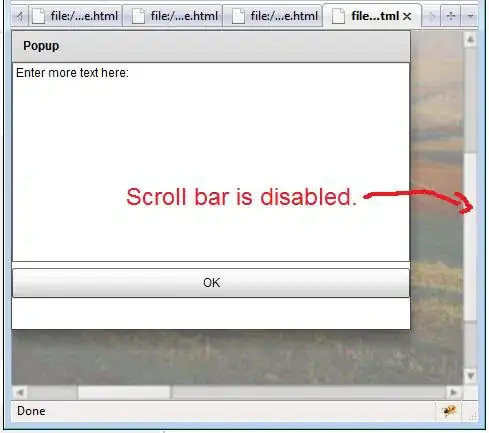
The problem is that the chart does not render. As I am currently using the un-paid version of CanvasJS, the watermark at the bottom is present. This watermarks is visible on the pop-up modal but the graph is not.
I read in one post that cloning CanvasJS is not possible (here), can anybody confirm this? If not, can anybody tell where I am going wrong or give me suggestions on how to achieve what I want? Minimum working example below with screenshot of modal.
p.s. I am also a complete newb to HTML/CSS/JS. This is my first time working with these techs.
Screenshot:
HTML:
<!DOCTYPE HTML>
<html>
    <head>
        <title>MWE</title>
        <meta charset="utf-8" />
        <meta name="SG-Dashboard" content="width=device-width, initial-scale=1" />
        <link rel="stylesheet" href="assets/css/main.css" />
    <link rel="stylesheet" href="assets/css/font-awesome.min.css">
    <script src="http://canvasjs.com/assets/script/canvasjs.min.js"></script>
    <script src="assets/js/jquery-3.2.0.min.js"></script>
    </head>
    <body>

    <article>
      <!-- Modal to expand graphs into -->
      <div id="graphModal" class="graph-modal">
        <button type="button" class="modal-cls-btn" onclick="closeGraphModal()">
            <i class="fa fa-compress fa-1x"></i>
        </button>
        <div id="graphModalBox" class="graph-modal-box"></div>
      </div>

      <!-- Graph 1 -->
      <div class="graph-box">
        <!-- Graph 1 header-->
        <div class="graph-box-header-button-container">
          <button type="button" id="graph-box-exp-btn" class="graph-btn" onclick="expandGraphModal(this)">
            <i class="fa fa-expand fa-1x"></i>
          </button>
        </div>
        <div class="canvasjs-container">
          <div id="Graph1" class="canvasjs-chart"></div>
        </div>
      </div>

    </article>

    <script src="assets/js/main.js"></script>

  </body>
</html>
CSS:
html, body, div, span, applet, object, iframe, h1, h2, h3, h4, h5, h6, p,        blockquote, pre, a, abbr, acronym, address, big, cite, code, del, dfn, em, img, ins, kbd, q, s, samp, small, strike, strong, sub, sup, tt, var, b, u, i, center, dl, dt, dd, ol, ul, li, fieldset, form, label, legend, table, caption, tbody, tfoot, thead, tr, th, td, article, aside, canvas, details, embed, figure, figcaption, footer, header, hgroup, menu, nav, output, ruby, section, summary, time, mark, audio, video {
    margin: 0;
    padding: 0;
    border: 0;
    font-size: 100%;
    font: inherit;
    vertical-align: baseline;
  }

  article, aside, details, figcaption, figure, footer, header, hgroup, menu, nav, section {
    display: block;
  }

  html, body{
    min-height: 100%;
  }

  body {
    line-height: 1;
    background-color: #fafafa;
    background-image: url("images/bg.png");
    font-size: 13pt;
  }


  article {
    height: 100%;
    min-width: 100%;
  }

  /* The modal background */
  .graph-modal {
     display: none;
     position: fixed;
     z-index: 1;
     left: 0;
     top: 0;
     min-width: 100%;
     max-height: 100%;
     height: 100%; /* Required for graph-modal-box height */
     background-color: rgba(0,0,0,0.4);
  }

  .graph-modal-box {
    display: block;
    position: relative;
    margin: 5% auto;
    background: #fff;
    box-shadow: inset 0px 0px 0px 0px rgba(0, 0, 0, 0.15), 0px 2px 3px 0px rgba(0, 0, 0, 0.1);
    /*min-height: 700px;
    max-height: 700px;*/
    min-height: 80%;
    max-height: 80%;
    min-width: 80%;
    max-width: 80%;
  }

  .modal-cls-btn {
    background-color: #414042;
    border: 0;
    float: right;
    margin: 10px;
  }

  .graph-box {
    /*position: relative;*/
    background: #fff;
    box-shadow: inset 0px 0px 0px 0px rgba(0, 0, 0, 0.15), 0px 2px 3px 0px rgba(0, 0, 0, 0.1);
    margin: 0.3em;
    vertical-align: top;
    min-height: 200px;
    max-height: 220px;
    min-width: 20%;
  }

  .graph-box-header-button-container {
    max-width: 25%;
    min-height: 20%;
  }

  .graph-btn {
    background-color: #414042;
    border: 0;
    cursor: pointer;
  }

  .canvasjs-container{
    width: 100%;
    height: 80%;
  }

  .canvasjs-chart{
    width: 100%;
    height: 100%;
  }
JS:
   var chart1 = new CanvasJS.Chart("Graph1", {
   data: [
   {
     type: "area",
     dataPoints: [
       {x: 1, y: 1},
       {x: 2, y: 2}]
   }],
});

charts=[chart1];

window.onload = function () {
  for (var i = 0; i < charts.length; i++) {
    var chart = charts[i];
    // chart.options.title.text += ": Updated";
    chart.render();
  }
}

// ------------Graph Modal----------------------//
// Get the modal
var graphModal = document.getElementById('graphModal');

function expandGraphModal(elem) {
  // get ancestor div
  var btnAnsestor = elem.closest(".graph-box");
  // Clone header and chart
  var modalGraph = btnAnsestor.getElementsByClassName("canvasjs-container")[0];

  // clone ancestor div and place in modal
  $("#graphModalBox").append($(modalGraph).clone(true));

  // // Render the graph
  chart1.render();
  graphModal.style.display = "block";
}

function closeGraphModal(){
  graphModal.style.display = "none";
  $("#graphModalBox").html("");
}
