Here is my simple assets dataset:
ID  Type    Currency    Value
a   Bond    GBP         10
b   Bond    EUR         20
c   Stock   GBP         3
d   Stock   GBP         60
e   Bond    GBP         8
f   Bond    USD         39
g   Stock   USD         1
Here is the code:
 assets <- read_excel("C:/R/SampleData.xlsx")
 g <- ggplot(assets, aes(Currency, Value))
 g + geom_col()
And this is the plot that I get:
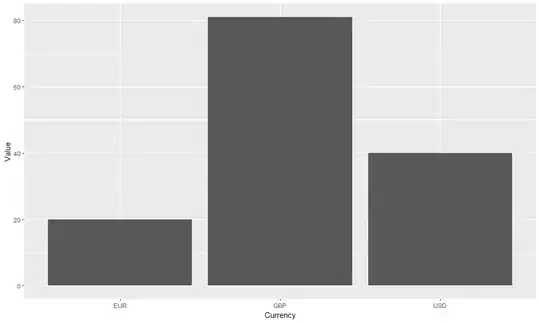
I am trying to create the same plot, but with bars sorted by value (in descending order) How do I achieve this? I have tried the following code:
assets$Currency <- factor(assets$Currency, levels = assets$Currency[order(assets$Value)])
But I get the following warning message and the chart is still not sorted correctly:
Warning message:
In `levels<-`(`*tmp*`, value = if (nl == nL) as.character(labels) else paste0(labels,  :
duplicated levels in factors are deprecated
Thanks!
