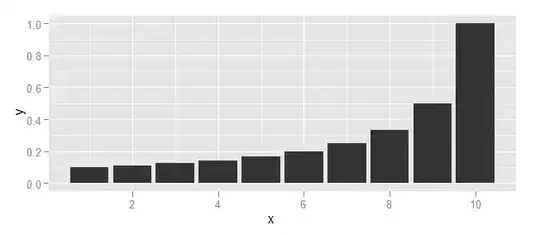
I would like to create a colour blind test, similar to that below, using ggplot.
The basic idea is to use geom_hex (or perhaps a voronoi diagram, or possibly even circles as in the figure above) as the starting point, and define a dataframe that, when plotted in ggplot, produces the image.
We would start by creating a dataset, such as:
df <- data.frame(x = rnorm(10000), y = rnorm(10000))
then plot this:
ggplot(df, aes(x, y)) +
  geom_hex() +
  coord_equal() +
  scale_fill_gradient(low = "red", high = "green", guide = FALSE) +
  theme_void()
which gives the image below:
The main missing step is to create a dataset that actually plots a meaningful symbol (letter or number), and I'm not sure how best to go about this without painstakingly mapping the coordinates. Ideally one would be able to read in the coordinates perhaps from an image file.
Finally, a bit of tidying up could round the plot edges by removing the outlying points.
All suggestions are very welcome!
EDIT
Getting a little closer to what I'm after, we can use the image below of the letter 'e':
Using the imager package, we can read this in and convert it to a dataframe:
img <- imager::load.image("e.png")
df <- as.data.frame(img)
then plot that dataframe using geom_raster:
ggplot(df, aes(x, y)) +
  geom_raster(aes(fill = value)) +
  coord_equal() +
  scale_y_continuous(trans = scales::reverse_trans()) +
  scale_fill_gradient(low = "red", high = "green", guide = FALSE) +
  theme_void()
If we use geom_hex instead of geom_raster, we can get the following plot:
ggplot(df %>% filter(value %in% 1), aes(x, y)) +
  geom_hex() +
  coord_equal() +
  scale_y_continuous(trans = scales::reverse_trans()) +
  scale_fill_gradient(low = "red", high = "green", guide = FALSE) +
  theme_void()
so, getting there but clearly still a long way off...
