I have a data set which has dates in the first column, and a "result" integer which is either 1 or 0. The date column was successfully converted to a time object. I tried to plot the values directly using matplotlib's plot function, but that did not work.. Sample:
    Date       Result
2017-01-06     0.0
2017-01-06     1.0
2017-01-06     0.0
2017-01-07     0.0
2017-01-07     0.0
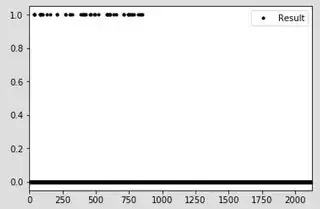
I tried using df.plot(), but the resulting plot has very undesirable results.
What I want at the end of the day is dates on the x axis, and the "result" on the y axis. Where am I going wrong? What's wrong with what I'm doing?