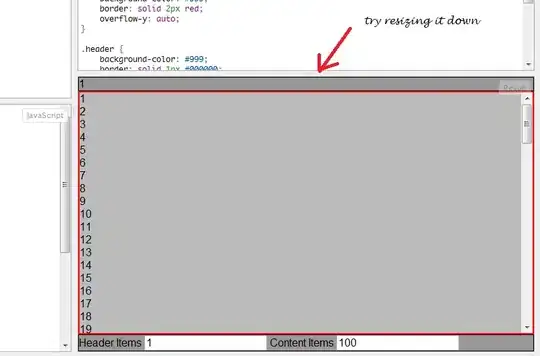
I am recently introduced in R. I am trying to create a bar plot from a data frame with 51 variable names just like the following example:
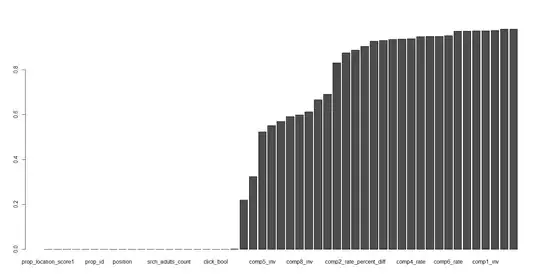
By using the barplot function I produced the following bar plot. Is there a way to display the variable names on the x-axis just like the above example:
Thanks in advance.

