2

I have two dataframes. Their lengths differ.

df1:
 Samples   Number
 A9GS        73
 A9GY        142
 ASNO        327
 A5UE        131

df2:
 Samples   Number
 AUFS        107
 A9JY        42
 AKNO        32
 A9FE        111
 A9GY        12
 ADNO        37
 A2KE        451

I have done wilcoxon test on this.

wilcox.test(df1$Number,df2$Number, correct=FALSE)

This gave me p-value. And to visualise this I used box plot function and gave an error like following.

boxplot(df1$Number ~ df2$Number, xlim=c(0.5,3))
Error in model.frame.default(formula = df1$Number ~ df2$Number) : 
  variable lengths differ (found for 'df2$Number')

Can anyone correct my mistake and also tell me how to get p-value on the plot. Thank you
beginner
  • 1,059
  • 8
  • 23

2 Answers2

2

You would only be able to use the formula if there were a 1-1 pairing of those to dataframes (with the RHS usually a group variable rather than a numeric one), which clearly there is not. You need to use the list delivery system rather than the formula one. I'll see if I can construct a working example.

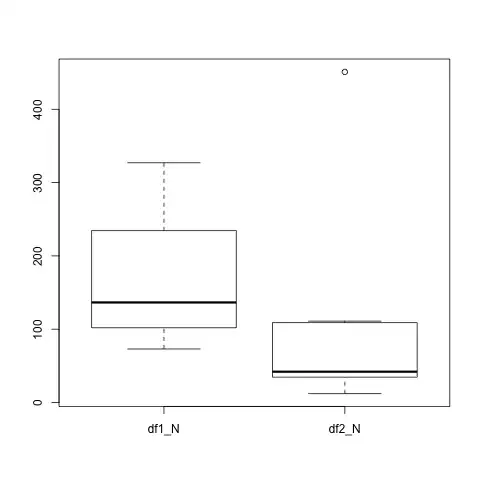
The plot is achieved with:

png(); boxplot( list(df1_N=df1$Number, df2_N = df2$Number) ); dev.off()

enter image description here

And annotation can be done with the text function which accepts a ?plotmath argument typically constructed with bquote.

text( 1.5, 400, 
   label=bquote( 
       p~value == .(wilcox.test(df1$Number,df2$Number, correct=FALSE)$p.value)
    ) )

If you wanted to round the p-value use round( ... ) around the expression inside the .( )-function

IRTFM
  • 258,963
  • 21
  • 364
  • 487
  • Error in wilcox.test.default(df1_N = df1$Number, df2_N = df2$Number, correct = FALSE) : argument "x" is missing, with no default – beginner May 08 '17 at 16:40
  • You forgot to put the two arguments in a list. – IRTFM May 09 '17 at 03:43
  • Hi, a small question I have 4 data frames now. I want to write P-value by drawing a line on the top of the boxes. For e.g.: A line between df1 and df2. Above the line I need P=some number. In the same way for others. between df2 and df3, df3 and df4. Can you please tell me how to do this? Thank you – beginner May 10 '17 at 12:21
  • Hello, Could you please answer to my previous comment – beginner May 10 '17 at 16:05
  • The `text` and `segment` functions can be used for annotation. The coordinates of a boxplot are returned by the `bxp` function. Read ?boxplot and follow all the links. – IRTFM May 10 '17 at 17:48
  • Can you please tell how to do this using those functions? I tried but didn't work. – beginner May 10 '17 at 17:50
  • And I don't need the text on the box plot. I need a bar(lines) between df1_N and df2_N. Above the bar(line) I need pvalue. – beginner May 10 '17 at 17:55
  • Sounds like you need a different question to be posted. – IRTFM May 11 '17 at 14:10
  • Or do a search: http://stackoverflow.com/questions/17084566/put-stars-on-ggplot-barplots-and-boxplots-to-indicate-the-level-of-significanc/27073333#27073333 – IRTFM May 11 '17 at 15:25
0

Just put the two data frames together, and then paste the pvalue onto the plot:

df1 <- data.frame(samples = c('A9GS', 'A9GY', 'ASNO', 'ASUE'),
                      number = c(73, 142, 327, 131))
df2 <- data.frame(samples=c('AUFS', 'A9JY', 'AKNO', 'A9FE', 'A9GY', 'ADNO', 
                                'A2KE'),
                      number = c(107, 42, 32, 111, 12, 37, 451))

df1$group <- 'df1'
df2$group <- 'df2'

df <- rbind(df1, df2)

m<-wilcox.test(df1$number,df2$number, correct=FALSE)

library(ggplot2)
jpeg('path/to/where/you/want/the/file/saved/picture.jpeg')
ggplot(df, aes(x=group, y=number, group=group)) + 
  geom_boxplot() +
  annotate('text', label=paste('p =', round(m$p.value, 2)), x=.5, y=400)
dev.off()

yields: enter image description here

triddle
  • 1,101
  • 8
  • 9
  • Thankyou. My df1 has 70 samples and df2 is 258. How can I save such huge plot? – beginner May 08 '17 at 15:53
  • I also want to see which data frame df1 or df2 on x-axis in the boxplot – beginner May 08 '17 at 16:27
  • I've edited my answer to include code that will save the image and write the dataframe names on the x axis. – triddle May 08 '17 at 17:23
  • But when I plotted this with my data. There is no p-value on the plot. As I said before the data frames are with 70 and 258 samples. Do I need to change any specifications to save the plot? – beginner May 09 '17 at 08:20