1

I have a data frame ('Example') like this.

        n CDCWeek Year Week
25.512324 2011-39 2011   39
26.363035  2011-4 2011    4
25.510500 2011-40 2011   40
25.810663 2011-41 2011   41
25.875451 2011-42 2011   42
25.860873 2011-43 2011   43
25.374876 2011-44 2011   44
25.292944 2011-45 2011   45
24.810807 2011-46 2011   46
24.793090 2011-47 2011   47
22.285000 2011-48 2011   48
23.015480 2011-49 2011   49
26.296376  2011-5 2011    5
22.074581 2011-50 2011   50
22.209183 2011-51 2011   51
22.270705 2011-52 2011   52
25.391377  2011-6 2011    6
25.225481  2011-7 2011    7
24.678918  2011-8 2011    8
24.382214  2011-9 2011    9

I want to plot this as a time series with 'CDCWeek' as the X-axis and 'n' as the Y using this code.

ggplot(Example, aes(CDCWeek, n, group=1)) + geom_line()

The problem I am running into is that it is not graphing CDCWeek in the right order. CDCWeek is the year followed by the week number (1 to 52 or 53 depending on the year). It is being graphed in the order shown in the data frame, with 2011-39 followed by 2011-4, etc. I understand why this is happening but is there anyway to force ggplot2 to use the proper order of weeks?

EDIT: I can't just use the 'week' variable because the actual dataset covers many years.

Thank you

4 Answers4

2

aweek::get_date allows you to get weekly dates only using the year and epiweek.

Here I created a reprex with a sequence of dates (link), extract the epiweek with lubridate::epiweek, defined sunday as start of a week with aweek::set_week_start, summarized weekly values, created a new date vector with aweek::get_date, and plot them.

library(tidyverse)
library(lubridate)
library(aweek)

data_ts <- tibble(date=seq(ymd('2012-04-07'),
                           ymd('2014-03-22'), 
                           by = '1 day')) %>% 
  mutate(value = rnorm(n(),mean = 5),
         #using aweek
         epidate=date2week(date,week_start = 7),
         #using lubridate
         epiweek=epiweek(date),
         dayw=wday(date,label = T,abbr = F),
         month=month(date,label = F,abbr = F),
         year=year(date)) %>% 
  print()
#> # A tibble: 715 x 7
#>    date       value epidate    epiweek dayw      month  year
#>    <date>     <dbl> <aweek>      <dbl> <ord>     <dbl> <dbl>
#>  1 2012-04-07  3.54 2012-W14-7      14 sábado        4  2012
#>  2 2012-04-08  5.79 2012-W15-1      15 domingo       4  2012
#>  3 2012-04-09  4.50 2012-W15-2      15 lunes         4  2012
#>  4 2012-04-10  5.44 2012-W15-3      15 martes        4  2012
#>  5 2012-04-11  5.13 2012-W15-4      15 miércoles     4  2012
#>  6 2012-04-12  4.87 2012-W15-5      15 jueves        4  2012
#>  7 2012-04-13  3.28 2012-W15-6      15 viernes       4  2012
#>  8 2012-04-14  5.72 2012-W15-7      15 sábado        4  2012
#>  9 2012-04-15  6.91 2012-W16-1      16 domingo       4  2012
#> 10 2012-04-16  4.58 2012-W16-2      16 lunes         4  2012
#> # ... with 705 more rows

#CORE: Here you set the start of the week!
set_week_start(7) #sunday
get_week_start()
#> [1] 7

data_ts_w <- data_ts %>% 
  group_by(year,epiweek) %>% 
  summarise(sum_week_value=sum(value)) %>% 
  ungroup() %>% 
  #using aweek
  mutate(epi_date=get_date(week = epiweek,year = year),
         wik_date=date2week(epi_date)
         ) %>% 
  print()
#> # A tibble: 104 x 5
#>     year epiweek sum_week_value epi_date   wik_date  
#>    <dbl>   <dbl>          <dbl> <date>     <aweek>   
#>  1  2012       1          11.0  2012-01-01 2012-W01-1
#>  2  2012      14           3.54 2012-04-01 2012-W14-1
#>  3  2012      15          34.7  2012-04-08 2012-W15-1
#>  4  2012      16          35.1  2012-04-15 2012-W16-1
#>  5  2012      17          34.5  2012-04-22 2012-W17-1
#>  6  2012      18          34.7  2012-04-29 2012-W18-1
#>  7  2012      19          36.5  2012-05-06 2012-W19-1
#>  8  2012      20          32.1  2012-05-13 2012-W20-1
#>  9  2012      21          35.4  2012-05-20 2012-W21-1
#> 10  2012      22          37.5  2012-05-27 2012-W22-1
#> # ... with 94 more rows

#you can use get_date output with ggplot
data_ts_w %>% 
  slice(-(1:3)) %>% 
  ggplot(aes(epi_date, sum_week_value)) + 
  geom_line() + 
  scale_x_date(date_breaks="5 week", date_labels = "%Y-%U") +
  theme(axis.text.x = element_text(angle = 90, hjust = 1)) +
  labs(title = "Weekly time serie",
       x="Time (Year - CDC epidemiological week)",
       y="Sum of weekly values")

ggsave("figure/000-timeserie-week.png",height = 3,width = 10)

Created on 2019-08-12 by the reprex package (v0.3.0)
enter image description here

avallecam
  • 669
  • 8
  • 8
  • I recommend using `aweek::week2date` instead of `aweek::get_date`. Here is an update of this last example: https://gist.github.com/avallecam/b5b9738c4eede2f1008daa514aeab2ae – avallecam Jan 22 '20 at 19:25
0

Convert the Year and Week into a date with dplyr:

df <- df %>% 
      mutate(date=paste(Year, Week, 1, sep="-") %>% 
                  as.Date(., "%Y-%U-%u"))

ggplot(df, aes(date, n, group=1)) + 
    geom_line() + 
    scale_x_date(date_breaks="8 week", date_labels = "%Y-%U")

enter image description here

Adam Quek
  • 6,973
  • 1
  • 17
  • 23
  • This mostly works. The only problem is that r imposes its own week numbering. This is a problem because CDC weeks (aka epi weeks or epidemiological weeks) are not exactly the same as the week numbering that r uses. CDC weeks start on Sundays, go from 1 to 52 to 53 (depending on the year) and week 1 is the first week with at least 4 days in the new calendar year. – Gregory Anderson May 09 '17 at 14:14
0

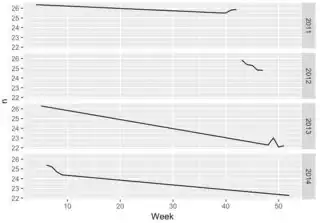
One option would be to use the Year and Week variables you already have but facet by Year. I changed the Year variable in your data a bit to make my case.

Example$Year = rep(2011:2014, each = 5)

ggplot(Example, aes(x = Week, y = n)) + 
  geom_line() + 
  facet_grid(Year~., scales = "free_x")
  #facet_grid(.~Year, scales = "free_x")

This has the added advantage of being able to compare across years. If you switch the final line to the option I've commented out then the facets will be horizontal.

enter image description here

Yet another option would be to group by Year as a factor level and include them all on the same figure.

ggplot(Example, aes(x = Week, y = n)) + 
  geom_line(aes(group = Year, color = factor(Year))) 

enter image description here

Nancy
  • 3,989
  • 5
  • 31
  • 49
0

It turns out I just had to order Example$CDCWeek properly and then ggplot would graph it properly.

1) Put the database in the proper order.

Example <- Example[order(Example$Year, Example$Week), ]

2) Reset the rownames.

row.names(Example) <- NULL

3) Create a new variable with the observation number from the rownames

Example$Obs <- as.numeric(rownames(Example))

4) Order the CDCWeeks variable as a factor according to the observation number

Example$CDCWeek  <-  factor(Example$CDCWeek, levels=Example$CDCWeek[order(Example$Obs)], ordered=TRUE)

5) Graph it

ggplot(Example, aes(CDCWeek, n, group=1)) + geom_line()

Thanks a lot for the help, everyone!