3

I can reproduce a working ggplot2 boxplot with the test data but not with CSV data in R. Data visually with single point about the events (sleep and awake)

"Vars"    , "Sleep", "Awake"
"Average" , 7      , 12
"Min"     , 4      , 5
"Max"     , 10     , 15

Data in real life about sleep

"Vars"    , "Sleep1", "Sleep2", ...
"Average" , 7       , 5
"Min"     , 4       , 3
"Max"     , 10      , 8

Data in real life about Awake

"Vars"    , "Awake1", "Awake2", ...
"Average" , 12      , 14
"Min"     , 10      , 7
"Max"     , 15      , 17

Code where data integrated

# only single point!
dat.m <- structure(list(Vars = structure(c(1L, 3L, 2L), .Label = c("Average ", 
"Max     ", "Min     "), class = "factor"), Sleep = c(7, 4, 10
), Awake = c(12L, 5L, 15L)), .Names = c("Vars", "Sleep", "Awake"
), class = "data.frame", row.names = c(NA, -3L))

library('ggplot2')    
# works:
str(mpg)
#mpg$class
#mpg$hwy
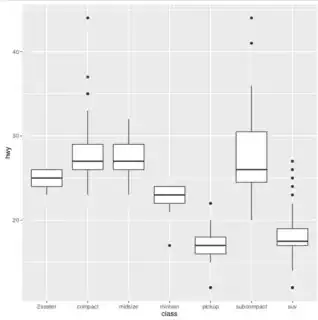
ggplot(mpg, aes(x = class, y = hwy)) +
    geom_boxplot()

# http://stackoverflow.com/a/44031194/54964
m <- t(dat.m)    
dat.m <- data.frame(m[2:nrow(m),])
names(dat.m) <- m[1,]
dat.m$Vars <- rownames(m)[2:nrow(m)]
dat.m <- melt(dat.m, id.vars = "Vars")

# TODO complicates here although should not
ggplot(dat.m, aes(x = Vars, y = value, fill=variable)) + #
    geom_boxplot() 

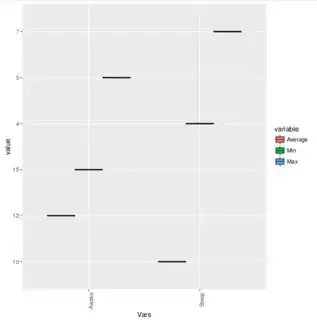
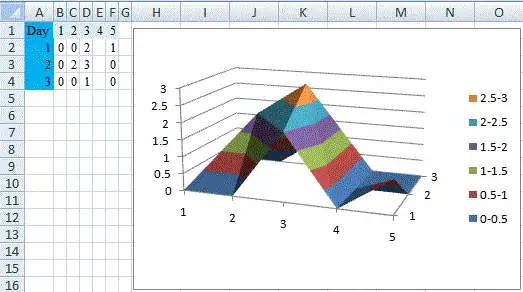
Test data output in Fig. 1 and Output in Fig. 2.

Fig. 1 Test data output, Fig. 2 Output of the code

enter image description here enter image description here

Assumption made below for the quartiles:

Code

 # http://stackoverflow.com/a/44043313/54964
 quartiles <- data.frame(Vars = c("Q1","Q3"), Sleep = c(6,8), 
               Awake = c(9,13))

I want to set Q1 <- 0.25 * average and Q3 <- 0.75 * average. Assume you have any amount of the main fields (here Sleep and Awake). How can you request the data (here dat.m) to get min and max of each main field?

R: 3.3.3
OS: Debian 8.7
Edgar Santos
  • 3,426
  • 2
  • 17
  • 29
Léo Léopold Hertz 준영
  • 134,464
  • 179
  • 445
  • 697
  • Are you trying to do a Boxplot with 3 observations? – Edgar Santos May 18 '17 at 05:48
  • 1
    But, if you really really want to plot it, try: library(ggplot2); library(reshape2); data <- melt(dat.m); ggplot(data, aes(x = variable, y = value)) + geom_boxplot() – Edgar Santos May 18 '17 at 06:01
  • 1
    Do you mean every variable? An 'observation' is a single value. If that's the case you should provide a better section of your dataset. – Edgar Santos May 18 '17 at 07:28
  • The data is still not useful. What you need for the plot is the 'raw' data. The function will compute internally the summary statistics e.g. median, IQR, min, max, etc; therefore these statistics are not useful in the dataset. – Edgar Santos May 18 '17 at 07:46
  • 1
    @ed_sans I have just the descriptive statistics, not the data itself, therefore I want to plot these values like that. Can it be done? – Léo Léopold Hertz 준영 May 18 '17 at 08:41

1 Answers1

1

There is base R function to make boxplots using the quartiles: bxp(), but you need 25th, 50th and 75th percentiles known as well as the lower quartile (Q1), the median (Q2) and upper quartile (Q3).

For example:

bxp(list(stats = matrix(c( 4,6,7,9,10, 10,11,12,14,15), nrow = 5,
 ncol = 2), n = c(30,30), names = c("Sleep", "Awake")))

enter image description here

Now using your data: (Edited)

Let us use the first dataset that you introduced:

dat.m <- structure(list(Vars = structure(c(1L, 3L, 2L), .Label = c("Average ", 
"Max     ", "Min     "), class = "factor"), Sleep = c(7, 4, 10
), Awake = c(12L, 5L, 15L)), .Names = c("Vars", "Sleep", "Awake"
), class = "data.frame", row.names = c(NA, -3L))

> dat.m
      Vars Sleep Awake
1 Average      7    12
2 Min          4     5
3 Max         10    15


> str(dat.m)
'data.frame':   3 obs. of  3 variables:
 $ Vars : Factor w/ 3 levels "Average ","Max     ",..: 1 3 2
 $ Sleep: num  7 4 10
 $ Awake: int  12 5 15

In you data, the first and third quartiles are missing. The second is also needed, which is the median, but let us assume that it is equal to the mean. I will assume that you have all of them e.g.:

quartiles <- data.frame(Vars = c("Q1","Q3"), Sleep = c(6,8), 
                    Awake = c(9,13))

> str(quartiles)
'data.frame':   2 obs. of  3 variables:
 $ Vars : Factor w/ 2 levels "Q1","Q3": 1 2
 $ Sleep: num  6 8
 $ Awake: num  9 13


data <- rbind(dat.m ,quartiles)

      Vars Sleep Awake
1 Average      7    12
2 Min          4     5
3 Max         10    15
4 Q1           6     9
5 Q3           8    13

Then sorting your variables:

library(dplyr)
## Disable this line if you want to use the universal approach
data <-  dplyr::arrange(data, Sleep, Awake)
## Enable the following for more universal approach
# data <- arrange_(data, .dots = as.list(strsplit(colnames(data)[2:ncol(data)], ', '))) 

bxp(list(stats = as.matrix(data[,2:3]), n = c(30,30), names = names(data[,2:3]))) # assuming n = 30.

With ggplot2

We first convert the dataset from 'wide' to 'long' format with reshape2::melt().

library(reshape2)
library(ggplot2)
(data2 <- melt(data))

       Vars variable value
1  Min         Sleep     4
2  Q1          Sleep     6
3  Average     Sleep     7
4  Q3          Sleep     8
5  Max         Sleep    10
6  Min         Awake     5
7  Q1          Awake     9
8  Average     Awake    12
9  Q3          Awake    13
10 Max         Awake    15

Then:

ggplot(data2, aes(x = variable, y = value)) +
  geom_boxplot()

enter image description here

You might find interesting these articles:

  1. Points of Significance: Visualizing samples with box plots (http://www.nature.com/nmeth/journal/v11/n2/full/nmeth.2813.html)
  2. The Box Plot: A Simple Visual Method to Interpret Data (http://annals.org/aim/article/703149/box-plot-simple-visual-method-interpret-data)
  3. Variations of box plots (http://amstat.tandfonline.com/doi/abs/10.1080/00031305.1978.10479236)
Léo Léopold Hertz 준영
  • 134,464
  • 179
  • 445
  • 697
Edgar Santos
  • 3,426
  • 2
  • 17
  • 29
  • 1
    @LéoLéopoldHertz준영, please, see the edit above in section 'With your data'. – Edgar Santos May 20 '17 at 10:32
  • 1
    @LéoLéopoldHertz준영 maybe replace that line by: data <- arrange_(data, .dots = as.list(strsplit(colnames(data)[2:ncol(data)], ', '))) – Edgar Santos May 20 '17 at 12:49
  • 1
    These values (Q1 and Q3) are expected to be given or included in your dataset (dat.m) or summary statistics. For this particular example, I manually entered some values to explain the functions. – Edgar Santos May 20 '17 at 13:02
  • 1
    @LéoLéopoldHertz준영, you can calculate the quartiles including the median if you have the RAW or whole (ungrouped) data. In this example, you just have the Max, Min and Mean values, which is not enough to compute the quartiles. – Edgar Santos May 20 '17 at 13:11
  • I extended the estimation of quartiles here https://stats.stackexchange.com/q/280723/3017 Maybe, some rough estimates representing quartiles would be enough. - - How can you request the data min and max for each main field ( here `Sleep` and `Awake`)? – Léo Léopold Hertz 준영 May 20 '17 at 14:27
  • 1
    The quartiles are independent measures and I don't think you could get a proper estimate using just the mean, min and max. For example, if your distribution is right-skewed the third quartile will be very different to Q3 = 0.75 * mean that you are suggesting. – Edgar Santos May 20 '17 at 22:43
  • 1
    You can't make inference about the underlying distribution 'solely' based on the mean, max, and min. That's what in the Glen explained in your Cross Validated post. For these different questions, you might want to consider a different post. – Edgar Santos May 21 '17 at 03:50
  • Extension of the thread to the partial presentation fo the values here https://stackoverflow.com/a/44140178/54964 – Léo Léopold Hertz 준영 May 26 '17 at 09:19