Goal
Present the results of multiple models, created using the lm() function, together in a nicely-formatted table. This table will be generated in a .Rmd file and output to a PDF document.
Proposed Solution
In Reproducible Research with R and RStudio, there is an example using the apsrtable() function to display multiple models side-by-side. This book provides the following code (p. 173-174):
Code
\begin{table}
    \caption{Example Nested Estimates Table with \emph{aprstable}}
    \label{BasicApsrTableExample}
        \begin{center}
<<results= asis , echo=FALSE>>=
# Load apsrtable package
library(apsrtable)
# Create nested regression model table
apsrtable(M1, M2, M3, M4, M5, Sweave = TRUE,
      stars = "default")
@
       \end{center}
\end{table}
where the models M1 ... M5 are created in chunks using M2 <- lm(Examination ~ Education + Agriculture, data = swiss).
Output
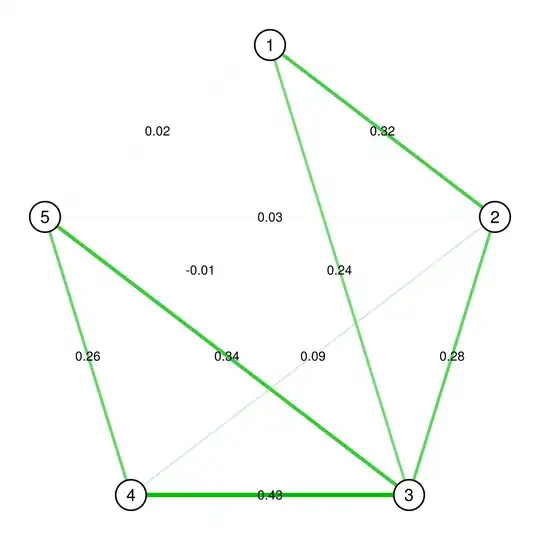
Below is a screen grab of the results, as reported in the book. This is exactly the table I want to create in my .Rmd file and output to a PDF document.
Issues
Attempt 1
When I try to use this code inside a code chunk—as shown below—and the output to a PDF, I get a an error message: Error: $ operator is invalid for atomic vectors
```{r}
t.model2 = xtable(model2,label = NULL)
t.model3 = xtable(model3,label = NULL)

library(apsrtable)

apsrtable(t.model2, t.model3, Sweave = TRUE, stars = "default")
```
Attempt 2 When I use the above code outside a code chunk, the .Rmd file outputs to PDF, but displays the following:
Questions
My Questions
- Why are these attempts failing?
- What is the correct way to use the
apsrtablefunction inside a .Rmd? - Will this method work to ouput this .Rmd file to PDF?
Related Stack Overflow Questions


