Similar to this question, I'm running into memory issues with Dask distributed. However, in my case the explanation is not that the client is trying to collect a large amount of data.
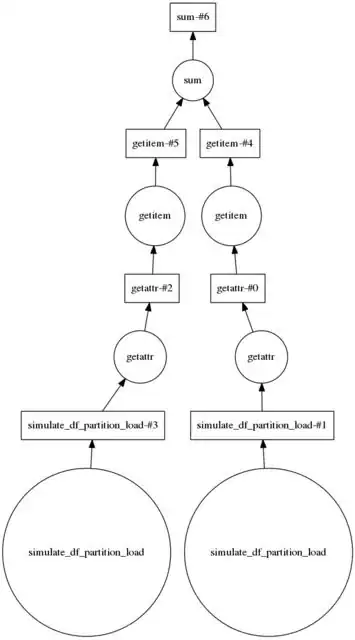
The problem can be illustrated based on a very simple task graph: A list of delayed operations generate some random DataFrames of a fixed size of ~500 MB (to simulate loading many partitions from files). The next operation in the task graph is to take the size of each DataFrame. Finally all sizes are reduced into one total size, i.e., the data that has to be returned to the client is small.
For testing purposes, I'm running a local scheduler/worker single-threaded, limited to 2GB memory, i.e.:
$ dask-scheduler
$ dask-worker localhost:8786 --nthreads 1 --memory-limit 2000000000
My expectation from the task graph is that the worker should never need much more than 500 MB of RAM, because running "get data size" directly after "generate data" should make the data small immediately. However, I'm observing that the worker needs much more memory than that:
The factor of 2 indicates that the data has to be duplicated internally. Therefore any attempts to bring the partition size close to the physical memory of a node results in MemoryErrors or heavy swapping.
Any information to shed some light on this is highly appreciated. In particular:
- Do I have any control over the duplication of the data, and is it something that can be avoided? Or is the general rule of thumb to keep the payload well below 50% to account for the data duplication?
- How does the worker
memory-limitaffect this behavior? From my tests, using a lower threshold seems to trigger GC earlier (and/or spill-to-disk?), but on the other hand there are other memory peaks which even exceed the peak memory of using a higher threshold.
Note that I'm aware that I could solve this particular issue by taking the size within the first operation, and probably Dask's single machine executor is better suited for the problem, but I'm asking for educational purposes.
Attachment 1: Test code
from __future__ import division, print_function
import pandas as pd
import numpy as np
from dask import delayed
from dask.distributed import Client, Executor


def simulate_df_partition_load(part_id):
    """
    Creates a random DataFrame of ~500 MB
    """
    num_rows = 5000000
    num_cols = 13

    df = pd.DataFrame()
    for i in xrange(num_cols):
        data_col = np.random.uniform(0, 1, num_rows)
        df["col_{}".format(i)] = data_col
        del data_col    # for max GC-friendliness

    print("[Partition {}] #rows: {}, #cols: {}, memory: {} MB".format(
        part_id, df.shape[0], df.shape[1],
        df.memory_usage().sum() / (2 ** 20)
    ))
    return df


e = Executor('127.0.0.1:8786', set_as_default=True)

num_partitions = 2

lazy_dataframes = [
    delayed(simulate_df_partition_load)(part_id)
    for part_id in xrange(num_partitions)
]

length_partitions = [df.shape[0] for df in lazy_dataframes]
dag = delayed(sum)(length_partitions)

length_total = dag.compute()
Attachment 2: DAG illustration

