0

I'm trying to plot a pandas Series, with part of the Series in a different color. Something like this, but I only have two colors:

Example plot

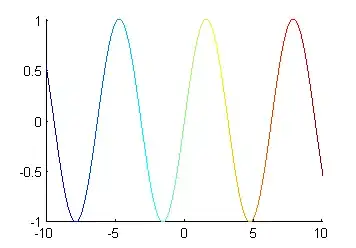
I have a second binary Series that contains 0's and 1's to indicate which points should be colored differently. How could I go about this?

ImportanceOfBeingErnest
  • 321,279
  • 53
  • 665
  • 712
sdcbr
  • 7,021
  • 3
  • 27
  • 44
  • 1
    There is even a [matplotlib example](http://matplotlib.org/examples/pylab_examples/multicolored_line.html) about it. Now it may well be that those linked questions do not help you. In that case you need to edit your question with a specific problem description, see [ask]. – ImportanceOfBeingErnest Jun 12 '17 at 14:13
  • I will have a look at the examples you mention. Either way, I wonder if there is no pandas solution to this. – sdcbr Jun 12 '17 at 14:18
  • 1
    No there is no "pandas solution", since pandas simply provides wrapper functions to create matplotlib plots and it cannot provide a wrapper for each and every possible case. – ImportanceOfBeingErnest Jun 12 '17 at 14:21
  • It depends, you can still edit it to include a [mcve] of the issue with the actual data format you're having and a specific problem description, including in how far the example and linked questions are not helping, in case they aren't or in case you get an error. – ImportanceOfBeingErnest Jun 12 '17 at 14:44
  • I have managed to do it with the matplotlib example, I was just hoping for an easier solution because it looked like something trivial to me. Thanks for the help. – sdcbr Jun 12 '17 at 14:48
  • Ok, not deleting the question would have the advantage that other people searching for a similar solution may find it and not ask a new question about the same thing. At the end it's your decision. – ImportanceOfBeingErnest Jun 12 '17 at 14:52
  • Let's leave it up in that case. Thanks! – sdcbr Jun 12 '17 at 14:53

0 Answers0