I am plotting a series of time intervals against a character vector of a length of 130. Currently, the y-axis labels are numbered from 0-120 by 20s.
Is there a way to replace the numbered y-axis labels with text labels that show what variety corresponds to what time interval?
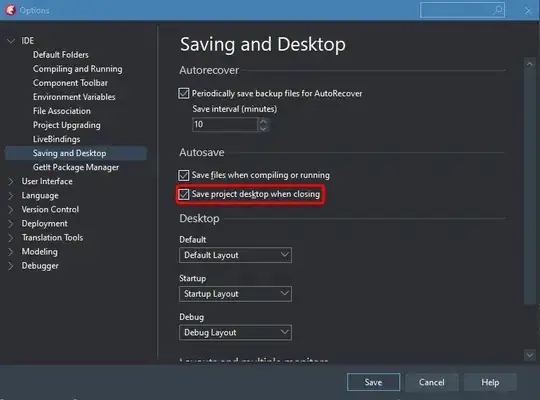
Here is an image of the plot I'm describing as it currently is: