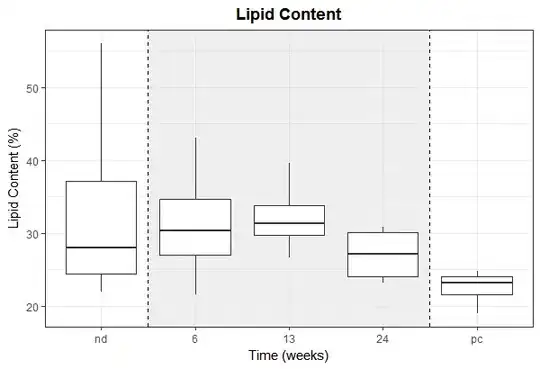
I want the grey background highlight to line up with the two vertical dashed lines that I've inserted into my plot. I can get the highlight to line up with "nd" and "pc", but I'd like the background to align between the two time points (pre/post treatment).
I've tried identifying the border of the highlight as x= 1.5 and 4.5, like I've done with the dashed lines, but I get "Error: Discrete value supplied to continuous scale" as a result.
Data:
> dput(LipCon)
structure(list(ChillTime = structure(c(1L, 1L, 1L, 1L, 2L, 2L,
2L, 2L, 3L, 3L, 3L, 3L, 4L, 4L, 4L, 4L, 5L, 5L, 5L, 5L), .Label = c("nd",
"6", "13", "24", "pc"), class = "factor"), Lipid = c(30.85703644,
21.91554596, 25.19641351, 56.05474457, 43.02224726, 31.93075251,
21.50358848, 28.74947619, 31.81816769, 30.68972065, 26.63482725,
39.6305118, 29.90226926, 24.28663997, 23.10808485, 30.8010717,
23.78336938, 18.92581619, 24.73146066, 22.48963284)), .Names = c("ChillTime",
"Lipid"), row.names = c(NA, -20L), class = "data.frame")
My current code is as follows:
ggplot(LipCon, aes(x = ChillTime, y = Lipid)) +
  theme_bw() +
  labs(x = 'Time (weeks)', y = 'Lipid Content (%)') +
  ggtitle("Lipid Content") +
  theme(plot.title = element_text(hjust = 0.5, face='bold')) +
  geom_rect(aes(xmin = 'nd', xmax = 'pc', ymin=-Inf, ymax=Inf), alpha=0.6, fill="grey90") +
  geom_boxplot() +
  geom_vline(aes(xintercept=1.5), linetype="dashed") +
  geom_vline(aes(xintercept=4.5), linetype="dashed")


