47

In Python, with Matplotlib, how to simply do a scatter plot with transparency (alpha < 1), but with a color bar that represents their color value, but has alpha = 1?

Here is what one gets, with from pylab import *; scatter(range(10), arange(0, 100, 10), c=range(10), alpha=0.2); color_bar = colorbar():

alt text

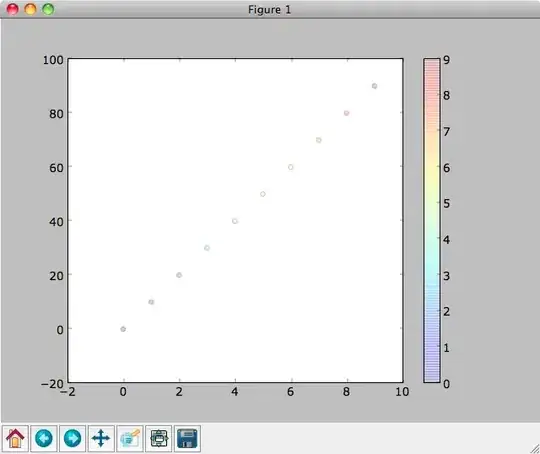
How can the color bar be made non-transparent?

PS: I tried color_bar.set_alpha(1); draw(), but this did not do anything…

Eric O. Lebigot
  • 91,433
  • 48
  • 218
  • 260

3 Answers3

46

Alright, I found one way to do it, that looks relatively clean: (using the ColorBar object from the question)

color_bar.set_alpha(1)
color_bar.draw_all()
# pylab.draw() or pyplot.draw() might be necessary

It would be great to get a confirmation that this is the most robust way to proceed, though! :)

Eric O. Lebigot
  • 91,433
  • 48
  • 218
  • 260
  • What if I don't want the colorbar labels? `draw_all()` makes the labels appear even if I have set `color_bar.ax.set_yticklabels([])`. – David Ketcheson Sep 24 '14 at 06:12
  • I'm not sure how to do this… I tried to clear the color bar axes first (`color_bar.ax.cla()`), but then drawing the colorbar again with `draw_all()` fails. – Eric O. Lebigot Sep 24 '14 at 08:56
  • 10
    On a side note, you can also use `cbar.solids.set(alpha=1)` if you'd prefer not to call `draw_all()` for any particular reason (e.g. custom labels, etc). – Joe Kington Jan 12 '16 at 14:39
15

This is a huge, ugly hack. But no other way would work. Maybe someone else can improve.

fig1 = pylab.figure()
fig2 = pylab.figure()
ax1 = fig1.add_subplot(111)
ax2 = fig2.add_subplot(111)
ax1.scatter(range(10), range(10), c=range(10), alpha=0.2)
im = ax2.scatter(range(10), range(10), c=range(10), alpha=1.0)
fig1.colorbar(im, ax=ax1)
fig1.show()

alt text

Steve Tjoa
  • 59,122
  • 18
  • 90
  • 101
0

Joe Kington's comment is the correct way to do this as matplotlib 6.0 has depreciated cbar.draw_all()

import matplotlib.pyplot as plt
fig, ax = plt.subplots()
im = ax.scatter(range(10), range(10), c=range(10), alpha=0.2)
cbar = fig.colorbar(im, ax=ax)
cbar.solids.set(alpha=1)

The depretiation warning: MatplotlibDeprecationWarning: The draw_all function was deprecated in Matplotlib 3.6 and will be removed two minor releases later. Use fig.draw_without_rendering() instead. cbar.draw_all()