0

I want to move a red star marker along the spiral trajectory with an equal distance of 5 units between the red star points on its circumference like in the below image.

vertspacing = 10;
horzspacing = 10;
thetamax = 10*pi;
% Calculation of (x,y) - underlying archimedean spiral.
b = vertspacing/2/pi;
theta = 0:0.01:thetamax;
x = b*theta.*cos(theta)+50;
y = b*theta.*sin(theta)+50;

% Calculation of equidistant (xi,yi) points on spiral.
smax = 0.5*b*thetamax.*thetamax;
s = 0:horzspacing:smax;
thetai = sqrt(2*s/b);
xi = b*thetai.*cos(thetai);
yi = b*thetai.*sin(thetai);
plot(x,y,'b-');
hold on

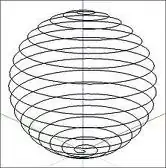
I want to get a figure that looks like the following:

image

This is my code for the circle trajectory:

% Initialization steps.
format long g;
format compact;
fontSize = 20;
r1 = 50;
r2 = 35;
r3=  20;
xc = 50;
yc = 50;
% Since arclength = radius * (angle in radians),
% (angle in radians) = arclength / radius = 5 / radius.
deltaAngle1 = 5 / r1;
deltaAngle2 = 5 / r2;
deltaAngle3 = 5 / r3;
theta1 = 0 : deltaAngle1 : (2 * pi);
theta2 = 0 : deltaAngle2 : (2 * pi);
theta3 = 0 : deltaAngle3 : (2 * pi);
x1 = r1*cos(theta1) + xc;
y1 = r1*sin(theta1) + yc;
x2 = r2*cos(theta2) + xc;
y2 = r2*sin(theta2) + yc;
x3 = r3*cos(theta3) + xc;
y3 = r3*sin(theta3) + yc;
plot(x1,y1,'color',[1 0.5 0])
hold on
plot(x2,y2,'color',[1 0.5 0])
hold on
plot(x3,y3,'color',[1 0.5 0])
hold on

% Connecting Line:
plot([70 100], [50 50],'color',[1 0.5 0])
% Set up figure properties:
% Enlarge figure to full screen.
set(gcf, 'Units', 'Normalized', 'OuterPosition', [0, 0, 1, 1]);
drawnow;
axis square;
for i = 1 : length(theta1)
    plot(x1(i),y1(i),'r*')
    pause(0.1)
end
for i = 1 : length(theta2)
    plot(x2(i),y2(i),'r*')
    pause(0.1)
end
for i = 1 : length(theta3)
    plot(x3(i),y3(i),'r*')    
    pause(0.1)
end
Dev-iL
  • 23,742
  • 7
  • 57
  • 99
zein
  • 35
  • 6
  • What have you tried? Do you have data/code for spiral path? – Siva Srinivas Kolukula Jul 05 '17 at 03:44
  • 1
    Hi zein, welcome to SO. Please take a look into this to improve your question(s): https://stackoverflow.com/help/how-to-ask – petezurich Jul 05 '17 at 03:54
  • I want to move a star marker on the SPIRAL trajectory like the following code which a red star marker moves a Circle trajectory I don't know how to write its code. https://www.dropbox.com/s/tr8dyutzie72rr4/Circle%20trajectory.txt?dl=0 – zein Jul 05 '17 at 08:24
  • Thanks for your help. – zein Jul 05 '17 at 08:53
  • @zein - when you say "distance of 5" do you mean planar, (i.e. dx^2+dy^2==5) or "along the spiral"? – Dev-iL Jul 05 '17 at 13:09
  • I mean along the spiral... I don't know how to explain it about spiral trajectory but for the case of circle trajectory the distance between the markers on the circumference is equal to 5 units. for example for the circle with radius of 50 we have: circumference= 2*pi*r=2*3.14*50=314 And we have 314/5= 62.8 ~ 63 markers on the circle. I want the same thing about spiral trajectory. – zein Jul 05 '17 at 13:28
  • Possibly related: https://stackoverflow.com/questions/13894715/draw-equidistant-points-on-a-spiral – Dev-iL Jul 05 '17 at 15:09

1 Answers1

2

I can't think of a way to compute distance along a spiral, so I'm approximating it with circles, in hopes that it will still be useful.

My solution relies on the InterX function from FEX, to find the intersection of circles with the spiral. I am providing an animation so it is easier to understand.

The code (tested on R2017a):

function [x,y,xi,yi] = q44916610(doPlot)
%% Input handling:
if nargin < 1 || isempty(doPlot)
  doPlot = false;
end
%% Initialization:
origin = [50,50];
vertspacing = 10;
thetamax = 5*(2*pi);
%% Calculation of (x,y) - underlying archimedean spiral.
b = vertspacing/(2*pi);
theta = 0:0.01:thetamax;
x = b*theta.*cos(theta) + origin(1);
y = b*theta.*sin(theta) + origin(2);
%% Calculation of equidistant (xi,yi) points on spiral.
DST = 5; cRes = 360; 
numPts = ceil(vertspacing*thetamax); % Preallocation
[xi,yi] = deal(NaN(numPts,1));

if doPlot && isHG2() % Plots are only enabled if the MATLAB version is new enough.
  figure(); plot(x,y,'b-'); hold on; axis equal; grid on; grid minor;
  hAx = gca; hAx.XLim = [-5 105]; hAx.YLim = [-5 105];
  hP = plot(xi,yi,'r*');
else
  hP = struct('XData',xi,'YData',yi);
end
hP.XData(1) = origin(1); hP.YData(1) = origin(2);
for ind = 2:numPts
  P = InterX([x;y], makeCircle([hP.XData(ind-1),hP.YData(ind-1)],DST/2,cRes));  
  [~,I] = max(abs(P(1,:)-origin(1)+1i*(P(2,:)-origin(2))));
  if doPlot, pause(0.1); end
  hP.XData(ind) = P(1,I); hP.YData(ind) = P(2,I);
  if doPlot, pause(0.1); delete(hAx.Children(1)); end
end
xi = hP.XData(~isnan(hP.XData)); yi = hP.YData(~isnan(hP.YData));

%% Nested function(s):
function [XY] = makeCircle(cnt, R, nPts)
  P = (cnt(1)+1i*cnt(2))+R*exp(linspace(0,1,nPts)*pi*2i);
  if doPlot, plot(P,'Color',lines(1)); end
  XY = [real(P); imag(P)];
end

end

%% Local function(s):
function tf = isHG2()
  try
    tf = ~verLessThan('MATLAB', '8.4');
  catch
    tf = false;
  end
end

function P = InterX(L1,varargin)
    % DOCUMENTATION REMOVED. For a full version go to:
    % https://www.mathworks.com/matlabcentral/fileexchange/22441-curve-intersections

    narginchk(1,2);
    if nargin == 1
        L2 = L1;    hF = @lt;   %...Avoid the inclusion of common points
    else
        L2 = varargin{1}; hF = @le;
    end

    %...Preliminary stuff
    x1  = L1(1,:)';  x2 = L2(1,:);
    y1  = L1(2,:)';  y2 = L2(2,:);
    dx1 = diff(x1); dy1 = diff(y1);
    dx2 = diff(x2); dy2 = diff(y2);

    %...Determine 'signed distances'   
    S1 = dx1.*y1(1:end-1) - dy1.*x1(1:end-1);
    S2 = dx2.*y2(1:end-1) - dy2.*x2(1:end-1);

    C1 = feval(hF,D(bsxfun(@times,dx1,y2)-bsxfun(@times,dy1,x2),S1),0);
    C2 = feval(hF,D((bsxfun(@times,y1,dx2)-bsxfun(@times,x1,dy2))',S2'),0)';

    %...Obtain the segments where an intersection is expected
    [i,j] = find(C1 & C2); 
    if isempty(i), P = zeros(2,0); return; end

    %...Transpose and prepare for output
    i=i'; dx2=dx2'; dy2=dy2'; S2 = S2';
    L = dy2(j).*dx1(i) - dy1(i).*dx2(j);
    i = i(L~=0); j=j(L~=0); L=L(L~=0);  %...Avoid divisions by 0

    %...Solve system of eqs to get the common points
    P = unique([dx2(j).*S1(i) - dx1(i).*S2(j), ...
                dy2(j).*S1(i) - dy1(i).*S2(j)]./[L L],'rows')';

    function u = D(x,y)
        u = bsxfun(@minus,x(:,1:end-1),y).*bsxfun(@minus,x(:,2:end),y);
    end
end

Result:

Animation :)

Note that in the animation above, the diameter of the circle (and hence the distance between the red points) is 10 and not 5.

Dev-iL
  • 23,742
  • 7
  • 57
  • 99
  • Thanks for your answer dear Dev-iL, But I want the red star marker moves(traverses) along spiral trajectory similar to Circle trajectory that I added at the end of my Question.I don't know how to do it.and I also want the distance between star points on the circumference of the figure be equal to 5 units. – zein Jul 05 '17 at 12:04
  • Thanks, Unfortunately it doesn't work and only shows the first plot and shows these errors:Warning: Struct field assignment overwrites a value with class "double". See MATLAB R14SP2 Release Notes, Assigning Nonstructure Variables As Structures Displays Warning, for details. Undefined function 'InterX' for input arguments of type 'double'. Error in q44916610 (line 22) P = InterX([x;y], makeCircle([hP.XData(ind-1),hP.YData(ind-1)],DST/2,cRes)); – zein Jul 05 '17 at 15:27
  • @zein I've changed the code a bit to make it more likely to run on older MATLAB versions - give it a try now. – Dev-iL Jul 05 '17 at 16:06
  • Thanks, I ran it on both 2016 a and 2013 a, your new code has no error but it only shows the coordinates in command window but no figure is showed. – zein Jul 06 '17 at 14:34
  • @zein You should collect the outputs (e.g. `[x1,y1,x2,y2] = q44916610()`) and then plot them yourself however you like. The plotting within the function is animated, which is going to take additional time for no reason. – Dev-iL Jul 06 '17 at 14:37