3

In what way can I construct a two-way frequency table in Rmarkdown? Something like:
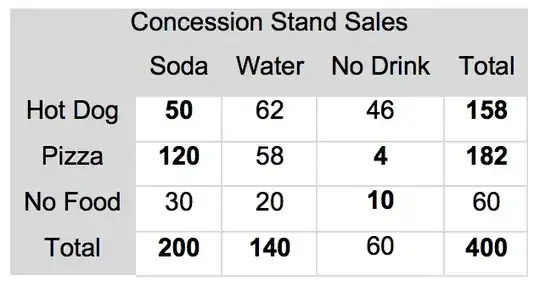
this

I tried to use both the kable function from the knitr package and the datable function from the DT package, but none gave me the desired result.

Update: Reproducible code with example.

a <- sample(x = c(1,2,3), size = 1000, replace = T)
b <- sample(x = c('a', 'b', 'c'), size = 1000, replace = T)

df <- data.frame(vertical_title = a, horitzontal_title = b)

table(df)

              horitzontal_title
vertical_title   a   b   c
             1 118  98 106
             2 106  95 121
             3 128 114 114

I want 'vertical_title' and 'horizontal_title' to be visible for my table in Rmarkdown.

Michael
  • 1,281
  • 1
  • 17
  • 32
  • Your question is difficult to answer like this. Please see [here](https://stackoverflow.com/questions/5963269/how-to-make-a-great-r-reproducible-example) for tips on how to provide a reproducible example. – Florian Jul 25 '17 at 16:07
  • Good point Florian, I was a bit in a hurry. I added a reproducible example. – Michael Jul 26 '17 at 09:28

1 Answers1

0

You can construct the table as follows:

---
title: Example 1
output: pdf_document
---

### This is a test

```{r,results='asis',echo=FALSE}

library(xtable)
a <- sample(x = c(1,2,3), size = 1000, replace = T)
b <- sample(x = c('a', 'b', 'c'), size = 1000, replace = T)

df <- data.frame(vertical_title = a, horitzontal_title = b)
df <- as.data.frame.matrix(table(df)) 


print(xtable(df,
            align = "|l|rrr|",
            caption = "Test"),
      caption.placement = 'top',
      comment = F,
      scalebox=1,
      include.rownames = T,
      hline.after = c(-1,0,nrow(df)),
      vline.after = c(1),
      format.args=list(big.mark = ",", decimal.mark = "."))


```

See here for a way to add multicolumn and multirows for your titles:

R package xtable, how to create a latextable with multiple rows and columns from R

Hope this helps!

Florian
  • 24,425
  • 4
  • 49
  • 80