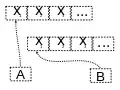
mystery reverses an array "in-place" by repeatedly snipping off the cdr of each entry and replacing that with the cdr of the previous x.
If this list has no loop, then it will end up reversed by the time you get back to the original '(). If there is a loop, you'll have the original array's pointer.
This is definitely a tricky to understand issue. If you make a box-and-pointer diagram it will definitely help and you'll only need to draw 3 diagrams.
Automatically Generating Diagrams of Lists
In the process of doing SICP myself, I found myself wanting a way to visualize list mutation (and to skip the numerous "draw a list diagram of..." exercises). I wrote a small function for doing so and I thought you might find it helpful if I shared it.
These diagrams are an example of this function being run on x each time loop (within the mystery function) is ran.
The following code is what I used for generating these diagrams. I wrote this code as a Scheme novice, but it's very simple to use: the function (list->graphviz) accepts a parameter lst which is the list you'd like a diagram of, as well as an optional argument graph-name which gives the graph a special name.
(define* (list->graphviz lst #:optional graph-name)
  """Convert a list into a set of Graphviz instructions
       `lst' is the list you'd like a diagram of
       `graph-name` is an optional parameter indicating the name you'd like to give the graph."""

  (define number 0)
  (define result "")
  (define ordinals '())
  (define (result-append! str)
    (set! result (string-append result str)))

  (define* (nodename n #:optional cell)
    (format #f "cons~a~a" n (if cell (string-append ":" cell) "")))

  (define* (build-connector from to #:optional from-cell)
    (format #f "\t~a -> ~a;~%" (nodename from from-cell) (nodename to)))

  (define (build-shape elt)
    (define (build-label cell)
      (cond ((null? cell) "/");; "∅") ; null character
            ((pair? cell) "*");; "•") ; bullet dot character
            (else (format #f "~a" cell))))
    (set! number (+ number 1))

    (format #f "\t~a [shape=record,label=\"<car> ~a | <cdr> ~a\"];~%"
            (nodename number)
            (build-label (car elt))
            (build-label (cdr elt))))

  (define* (search xs #:optional from-id from-cell)
    (let ((existing (assq xs ordinals)))
      (cond
       ;; if we're not dealing with a pair, don't bother making a shape
       ((not (pair? xs)) (result-append! "\tnothing [shape=polygon, label=\"not a pair\"]\n"))
       ((pair? existing)
        (result-append! (build-connector from-id (cdr existing) from-cell)))
       (else
        (begin
          (result-append! (build-shape xs))
          (set! ordinals (assq-set! ordinals xs number))
          (let ((parent-id number))
            ;; make a X->Y connector
            (if (number? from-id)
                (result-append! (build-connector from-id parent-id from-cell)))
            ;; recurse
            (if (pair? (car xs)) (search (car xs) parent-id "car"))
            (if (pair? (cdr xs)) (search (cdr xs) parent-id "cdr"))))))))

  (search lst)
  (string-append "digraph " graph-name " {\n" result "}\n"))

;;;;;;;;;;;;;;;;;;;;;;;;;;;;;;;;;;;;;;;;;;;;;;;;;;;;
;;;;;;;;; Here is where `mystery' begins ;;;;;;;;;;;
;;;;;;;;;;;;;;;;;;;;;;;;;;;;;;;;;;;;;;;;;;;;;;;;;;;;
(define t '(1 2 3))
(set-cdr! (cddr t) t)

(define (mystery x)
  (define (loop x y graph-num)
    (display (list->graphviz x (format #f "graph~a" graph-num)))
    (if (null? x)
        y
        (let ((temp (cdr x)))
          (set-cdr! x y)
          (loop temp x (+ 1 graph-num)))))
  (loop x '() 0))

(mystery t)
The code above code generates Graphviz graph description statements, which must then be processed by dot (Graphviz) to be rendered to a graphical format.
For example, you can run the code above and pipe it into dot:
$ scheme generate_box_ptr.scm | dot -o ptrs.ps -Tps
This command generates a postscript file which has the advantage of separating each list into it's own page if you've run list->graphviz more than once. dot can also output PNGs, PDFs and many other file formats as the manpage describes.


