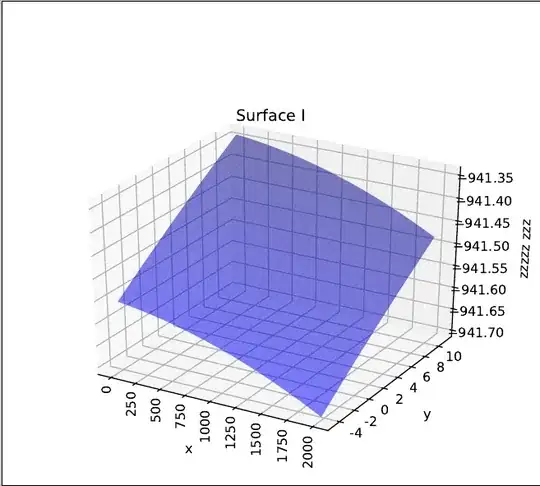
With the code below, I have produced a figure which I would like to save it in pdf. I use savefig command:
fig.savefig("Surface_I.pdf" )
The pdf file contains a lot of white space in left, and up:
fig.savefig("Surface_I.pdf", bbox_inches='tight') solution cuts out a bit of x and z information, without removing too much space from left and top:
The fig.savefig("Surface_I.pdf", bbox_inches='tight', pad_inches=0.3) solution adds some space, fixing the info just removed:
but there is still too much space in left and top.
How could I remove, or trim, all this left and top white space from the pdf?
Note: all these pictures are a screenshot of the pdf generated.
Code:
import numpy as np
from mpl_toolkits.mplot3d import Axes3D
import matplotlib.pyplot as plt

# Function:
z_fit = a0 + a1*yy + a2*xx + a3*yy**2 + a4*xx**2  + a5*xx*yy

# Parameters:
a0 =  -941.487789948
a1 =  0.0146881652963
a2 =  -2.53533353374e-05
a3 =  -9.64343252786e-05
a4 =  -2.47416662598e-08
a5 =  3.77136886946e-07

x_mesh = np.linspace(10.0000000000000, 2000.0000000000000, 20)
y_mesh = np.linspace(-4.4119598462100, 10.8557347078000, 20)

xx, yy = np.meshgrid(x_mesh, y_mesh)


# Plot the function
fig = plt.figure()
ax = fig.gca(projection='3d')

ax.plot_surface(xx, yy, z_fit, color='b', alpha=0.5)

ax.set_xlabel('\nx')
ax.set_ylabel('y')
ax.set_zlabel('\nzzzzz zzz', linespacing=3)
ax.set_title('\n\nSurface I', linespacing=3)
xlabels=[0, 250, 500, 750, 1000, 1250, 1500, 1750, 2000]
ax.set_xticklabels(xlabels,rotation=90,
                  verticalalignment='baseline',#)#,
                  horizontalalignment='left')

ylabels = [-4, -2, 0, 2, 4, 6, 8, 10]
ax.set_yticklabels(ylabels,rotation=0,
                  verticalalignment='baseline')#,
#                 horizontalalignment='left')


fig.savefig("Surface_I.pdf", bbox_inches='tight', pad_inches=0.3)


