4

Sometimes when I stop my Liferay module (for instance when I put a new version of its JAR in deploy/) the module refuses to stop.

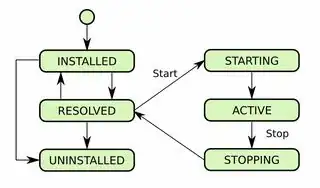
While the module should go to "Resolved" state, it stays in the "Stopping" state forever:

OSGi lifecycle

Usually it is due to a thread not terminated somewhere, or a network connection not properly closed, and it is often a pain to investigate.

My question: How to find out more efficiently what this Liferay module's problem is?

What I tried:

  • In Gogo Shell diag <module id> does not seem to provide any valuable information about why the module refuses to leave the "Stopping" state.
  • jstack outputs thousands of lines, the vast majority of which is outside of the Liferay module in question. If there was a way to show jstack information for only my module that would be wonderful.
Nicolas Raoul
  • 58,567
  • 58
  • 222
  • 373
  • 2
    Are you using an Activator inside your module? The state stopping means that Activator.stop() method was called but did not yet return. One of your threads should be in that method. – Christian Schneider Aug 01 '17 at 08:07
  • @ChristianSchneider: Added my ServiceActivator. – Nicolas Raoul Aug 01 '17 at 08:20
  • 1
    You are on the good track to solve the issue with jstack. It created a thread dump, but most of the threads have about 5-10 lines. Look for the thread that is much bigger, especially that has ServiceActivator.stop method call in it. Then you will see what is causing the deadlock or long sleeping. – Balazs Zsoldos Aug 01 '17 at 09:16
  • @BalazsZsoldos: Looking for ServiceActivator.stop is a great tip! Do you want to write an answer about it? Or I can write it if you have no time. – Nicolas Raoul Aug 01 '17 at 10:34
  • @NicolasRaoul I think looking at the thread dump and trying to find the code snippet it is more an advice than a real answer. If you want to make a response about it with the cause of the block, feel free. – Balazs Zsoldos Aug 01 '17 at 18:16

2 Answers2

1

First, find the PID of your webapp server:

ps aux | grep tomcat

Adapt the command if you are running another server than tomcat, or if you have several instances running.

Then, dump all threads of that server to a file:

jstack 12345 > jstack.txt

Where 12345 is the PID you found in the first step.

Then, look at the source code of your bundle, and find the service activator. It typically looks like this:

package fr.free.nrw;

[import section]

public class ServiceActivator implements BundleActivator {

    private ServiceRegistration registration;

    @Override
    public void start(BundleContext context) throws Exception {
        registration = context.registerService(
            MyService.class.getName(), new MyServiceImpl(), null);
    }

    @Override
    public void stop(BundleContext context) throws Exception {
        registration.unregister();
    }
}

Take note of:

  • the namespace,
  • the class name,
  • the stopping method name.

For instance in the example above they are fr.free.nrw, ServiceActivator and stop, and from these three get the full name fr.free.nrw.ServiceActivator.stop.

Now open jstack.txt and search for the full name. Even though the file is thousands of lines long, there will most probably only be one hit, and that is the problematic thread:

at org.eclipse.osgi.internal.serviceregistry.ServiceRegistrationImpl.unregister(ServiceRegistrationImpl.java:222)
at fr.free.nrw.ServiceActivator.stop(ServiceActivator.java:30)
at org.eclipse.osgi.internal.framework.BundleContextImpl$4.run(BundleContextImpl.java:830)
at org.eclipse.osgi.internal.framework.BundleContextImpl$4.run(BundleContextImpl.java:1)
at java.security.AccessController.doPrivileged(Native Method)
at org.eclipse.osgi.internal.framework.BundleContextImpl.stop(BundleContextImpl.java:823)

In this file, go up to the beginning of the paragraph, which will be something like this:

"fileinstall-/home/nico/p/liferay/osgi/modules" #37 daemon prio=5 os_prio=0 tid=0x00007f39480e3000 nid=0x384f waiting on condition [0x00007f395d169000]
  java.lang.Thread.State: WAITING (parking)
    at sun.misc.Unsafe.park(Native Method)
    - parking to wait for  <0x00000000eb8defb8> (a java.util.concurrent.locks.AbstractQueuedSynchronizer$ConditionObject)
    at java.util.concurrent.locks.LockSupport.park(LockSupport.java:175)

With this information in hand, you will known what kind of threading problem is going on, and you will be able to solve it with usual Java thread debugging techniques (1 2).
Nicolas Raoul
  • 58,567
  • 58
  • 222
  • 373
0

The Activator you shared should never block on the stop method. So I doubt it can cause the behavior you described.

Christian Schneider
  • 19,420
  • 2
  • 39
  • 64
  • 1
    It can be. The stop method of the Activator is called synchronously. He unregisters a service and that causes the call of synchronous service listeners (and service trackers). On ServiceTracker might get deadlocked. – Balazs Zsoldos Aug 01 '17 at 18:06
  • Ah .. interesting. So the reason could be some badly written service tracker or listener in some other bundle. – Christian Schneider Aug 01 '17 at 21:01
  • Could be. I was talking on the service tracker level, but one can easily make a mistake on higher levels, too. E.g.: One writes some business logic with sleeping or waiting in the setter of a service reference (or in the activate method) of a DS component. These code snippets are often called on the same thread as the service registration is done as they are based on synchronous service trackers. – Balazs Zsoldos Aug 02 '17 at 09:27