3

How can I scale the colorbar axis of a false color image?

I read this post,and copied the code but it seems not to work correctly:

MATLAB Colorbar - Same colors, scaled values

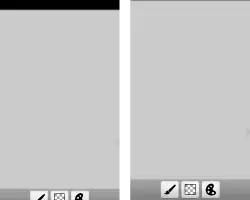
Please see the two images below. In the first (without the scaling) the coloraxis goes

[1 2 3 4 5 6]*10^4 

In the second image, it goes

[0.005 0.01 0.015 0.02 0.025]

The correct scaling (with C = 100000) would be

[0.1 0.2 0.3 0.4 0.5 0.6]

Without scaling without scaling

Wrong scaling wrong scaling

I want that the coloraxis is scaled by 1/C and I can freely choose C, so that when the pixel value = 10^4 and C=10^6 the scale should show 10^-2.


The reason why I multiply my image first by C is to get more decimals places, because all values below 1 will be displayed as zero without the C scaling.

When I run the code I get yticks as a workspace variable with the following values:

[500 1000 1500 2000 2500]

My code:

RGB = imread('IMG_0043.tif');% Read Image 
info = imfinfo('IMG_0043.CR2'); % get Metadata
C = 1000000; % Constant to adjust image

x = info.DigitalCamera; % get EXIF
t = getfield(x, 'ExposureTime');% save ExposureTime
f = getfield(x, 'FNumber'); % save FNumber
S = getfield(x, 'ISOSpeedRatings');% save ISOSpeedRatings
date = getfield(x,'DateTimeOriginal');
I = rgb2gray(RGB); % convert Image to greyscale
K = 480; % Kamerakonstante(muss experimentel eavaluiert werden) 
% N_s = K*(t*S)/power(f,2))*L 
L = power(f,2)/(K*t*S)*C; %
J = immultiply(I,L); % multiply each value with constant , so the Image is Calibrated to cd/m^2 

hFig = figure('Name','False Color Luminance Map', 'ToolBar','none','MenuBar','none');
% Create/initialize default colormap of jet.
cmap = jet(16); % or 256, 64, 32 or whatever.
% Now make lowest values show up as black.
cmap(1,:) = 0;
% Now make highest values show up as white.
cmap(end,:) = 1;

imshow(J,'Colormap',cmap) % show Image in false color
colorbar % add colorbar

h = colorbar; % define colorbar as variable

y_Scl = (1/C);
yticks = get(gca,'YTick');

set(h,'YTickLabel',sprintfc('%g', [yticks.*y_Scl]))

ylabel(h, 'cd/m^2')% add unit label
title(date); % Show date in image
caxis auto % set axis to auto
datacursormode on % enable datacursor

img = getframe(gcf);
nowstr = datestr(now, 'yyyy-mm-dd_HH_MM_SS');

folder = 'C:\Users\Taiko\Desktop\FalseColor\';
ImageFiles = dir( fullfile(folder, '*.jpg') );
if isempty(ImageFiles)
    next_idx = 1;
else
    lastfile = ImageFiles(end).name;
    [~, basename, ~] = fileparts(lastfile);
    file_number_str = regexp('(?<=.*_)\d+$', basename, 'match' );  
    last_idx = str2double(file_number_str);
    next_idx = last_idx + 1;
end

newfilename = fullfile( folder, sprintf('%s_%04d.jpg', nowstr, next_idx) );

imwrite(img.cdata, newfilename);
Wolfie
  • 27,562
  • 7
  • 28
  • 55
  • are you looking for `caxis`? – Tasos Papastylianou Aug 08 '17 at 14:59
  • well i am new to matlab and i just began to write this code. i tried it with and without the caxis auto but it doesn't make a difference. i think it is really weird that it generated the y ticks as [500 1000 1500 2000 2500] and i don't understand why. – Taiko Green Aug 08 '17 at 15:04
  • 1
    i uploaded test image files here: https://www.sendspace.com/file/1v5z48 – Taiko Green Aug 08 '17 at 16:33
  • For the love of any superior being, DO NOT USE JET FOR THIS – Ander Biguri Aug 08 '17 at 16:39
  • 2
    @Yvon Read (and watch) here: https://bids.github.io/colormap/ .In short: it is perceptually non-uniform. The same change in data would change the color from dark blue to almost light blue , or in a different place from yellow to orange to red. It shows (to the human eye) peaks and data change rates that are not in the data. It is also incredibly non-realistic when used in images. Just choose `parula` or `hot` and plot the same data, looks way more natural – Ander Biguri Aug 08 '17 at 16:48
  • @Yvon Steve from Mathworks also did a couple of posts about why jet is not default anymore, see this and the next post: http://blogs.mathworks.com/steve/2014/10/13/a-new-colormap-for-matlab-part-1-introduction/ – Ander Biguri Aug 08 '17 at 16:51
  • 1
    This is great. Thank you! – Yvon Aug 08 '17 at 16:51
  • 1
    i changed the colormap to parula – Taiko Green Aug 08 '17 at 17:02
  • 1
    @TaikoGreen great choice! I put the python colormaps to MATLAB if you are interested, here you can find them: https://uk.mathworks.com/matlabcentral/fileexchange/51986-perceptually-uniform-colormaps – Ander Biguri Aug 08 '17 at 17:15

1 Answers1

3

Problems:

1) You are getting YTick of the figure (gca) but not the color bar. That would give you the "pixel" coordinates of the graph, instead of the actual values. Use yticks = get(h,'YTick');.

2) caxis auto Should come before overwriting YTicks (and after enabling the color bar); otherwise the scale and ticks will mismatch.

3) Do you mean C = 100000?

Result:

enter image description here

Yvon
  • 2,903
  • 1
  • 14
  • 36
  • C=10^6 would be appropriate for this image so that i can get the nightsky resolved(which will be the main purpose of this script) but it can also be used to measure the brightness of a facade. in this case you would choose a smaller C – Taiko Green Aug 08 '17 at 17:12
  • @TaikoGreen That would result in different tick values. Is that as expected? – Yvon Aug 08 '17 at 17:31
  • that is correct the picture you attached is with C=10^5, while the image i have attached is with 10^6. with you correction it shows now the correct tick values 0.01 to 0.06 – Taiko Green Aug 08 '17 at 18:00