I am trying to debug Python which I am using to manipulate HTML for the Google App Engine. I am new to programming and looking for an easy way to debug my code. Thanks in advance!
Asked
Active
Viewed 176 times
2 Answers
0
Normally, when you run your application in the command line mode:
python dev_appserver.py yourappname
Lots of debugging information is presented in the console for your app. You might also run
python dev_server.py --debug-imports yourappname
To get the logging while imports happing and the paths. ( I have rarely used that).
But inside your module, if you do print, that would be available from the console of your application too.
There are some modules ( I think its names screen), which you can include your application and have a remote debugger enabled which can see what is happening to each request and response. In your admin console look out for logs as they are very helpful too. You don't have to do anything special for that, it is part of the framework.
Senthil Kumaran
- 54,681
- 14
- 94
- 131
0
Here is a thread, How-to-debug-in-django-the-good-way should be applicable to App Engine.
I like:
- Werkzeug Debugger provides in webpage interactive console debugging.
- Tipfy ships with Werkzeug.
Werkzeug Debugger in action:
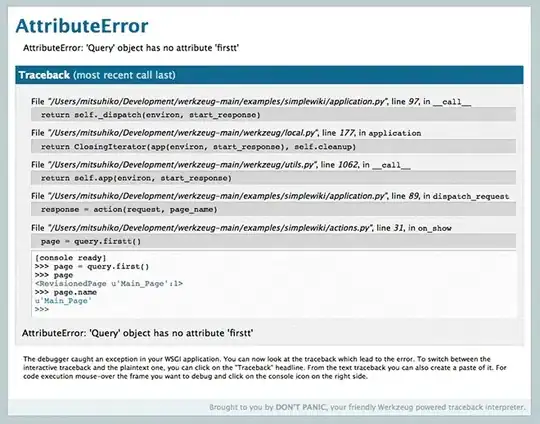
You simply click on a line in the stacktrace and it gives you a console then and there!!