the question/problem is very similar to the original question: change the decimal degrees to degrees minutes seconds in the ggplot axis labels.
I'm following these steps:
library(ggplot2)
library(ggmap)
#get my map
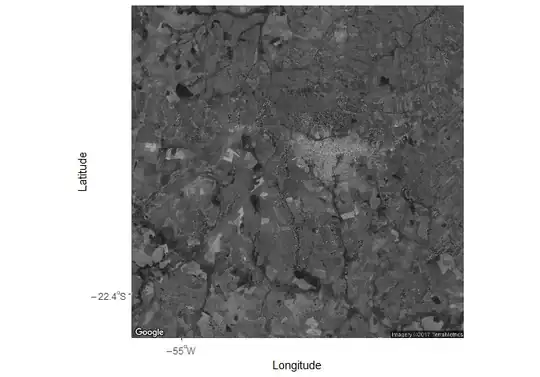
city<- get_map(location = c(lon= -54.847, lat= -22.25),
maptype = "satellite",zoom = 11,color="bw")
map<-ggmap(city,extent="normal")+
xlab("Longitude")+ ylab("Latitude")
map

In addition, I'm trying what @Jaap wrote:
scale_x_longitude <- function(xmin=-180, xmax=180, step=1, ...) {
  xbreaks <- seq(xmin,xmax,step)
  xlabels <- unlist(lapply(xbreaks, function(x) ifelse(x < 0, parse(text=paste0(x,"^o", "*W")), ifelse(x > 0, parse(text=paste0(x,"^o", "*E")),x))))
  return(scale_x_continuous("Longitude", breaks = xbreaks, labels = xlabels, expand = c(0, 0), ...))
}
scale_y_latitude <- function(ymin=-90, ymax=90, step=0.5, ...) {
  ybreaks <- seq(ymin,ymax,step)
  ylabels <- unlist(lapply(ybreaks, function(x) ifelse(x < 0, parse(text=paste0(x,"^o", "*S")), ifelse(x > 0, parse(text=paste0(x,"^o", "*N")),x))))
  return(scale_y_continuous("Latitude", breaks = ybreaks, labels = ylabels, expand = c(0, 0), ...))
}
So:
map+
  scale_x_longitude(-55.0,-54.7,4)+
  scale_y_latitude(-22.4,-22.1,4)
In the second map only two coordinates are draw and in the wrong format. I need these corrdinates written as follow:
55ºW, 54ºW 54',54ºW 48', 54ºW 42'; 22ºS 24', 22ºS 18', 22ºS 12', 22ºS 06'
Can anyone help me?
Update (16/08/2017) Here is a update code provided by @Rafael Cunha (Thanks a lot!) Still missing a way to add minutes symbol. However, it is working better than before.
scale_x_longitude <- function(xmin=-180, xmax=180, step=1, ...) {
  xbreaks <- seq(xmin,xmax,step)
  xlabels <- unlist(
    lapply(xbreaks, function(x){
      ifelse(x < 0, parse(text=paste0(paste0(abs(dms(x)$d),"^{o}*"),
                                      paste0(abs(dms(x)$m)), "*W")),
             ifelse(x > 0, parse(text=paste0(paste0(abs(dms(x)$d),"^{o}*"),
                                             paste0(abs(dms(x)$m)),"*E")),
                    abs(dms(x))))}))
  return(scale_x_continuous("Longitude", breaks = xbreaks, labels = xlabels, expand = c(0, 0), ...))
}

scale_y_latitude <- function(ymin=-90, ymax=90, step=0.5, ...) {
  ybreaks <- seq(ymin,ymax,step)
  ylabels <- unlist(
    lapply(ybreaks, function(x){
      ifelse(x < 0, parse(text=paste0(paste0(abs(dms(x)$d),"^{o}*"),
                                      paste0(abs(dms(x)$m)),"*S"),
             ifelse(x > 0, parse(text=paste0(paste0(abs(dms(x)$d),"^{o}*"),
                                             paste0(abs(dms(x)$m)),"*N")),
                    abs(dms(x))))}))
  return(scale_y_continuous("Latitude", breaks = ybreaks, labels = ylabels, expand = c(0, 0), ...))
}

map+
  scale_x_longitude(-55.0,-54.7,.1)+
  scale_y_latitude(-22.4,-22.1,.1)