I don't know of a general purpose parser, I thought I would try to look at the spec to see how complicated it would be. Here's a rough first pass at translating those commands to points. First, a helper function two calculate the second degree bezier curves:
c_curve<-function(start, c1, c2, end, n=100) {
  c1 <- start+c1
  c2 <- start+c2
  end <- start+end
  sapply((0:n)/n, function(i) {
    q1 <- start+i*(c1-start)
    q2 <- c1+i*(c2-c1)
    q3 <- c2+i*(end-c2)
    r1 <- q1+i*(q2-q1)
    r2 <- q2+i*(q3-q2)
    r1+i*(r2-r1)
  })
}
And then you can parse the string with
parse_svg_path <- function(path) {
  parts <- regmatches(path, gregexpr("[A-Za-z]|,|-?[0-9.]+", path, perl=T))[[1]]
  parts <- parts[parts!=","]
  vals <- suppressWarnings(as.numeric(parts))
  i <- 1
  points <- matrix(ncol=0, nrow=2)
  while(i < length(parts)) {
    if (parts[i]=="M") {
      points <- cbind(points, c(vals[i+1], vals[i+2]))
      i <- i+3
    } else if (parts[i]=="c") {
      cpoints <- c_curve(
        points[, ncol(points)],
        c(vals[i+1], vals[i+2]),
        c(vals[i+3], vals[i+4]),
        c(vals[i+5], vals[i+6])
      )
      points <- cbind(points, cpoints)
      i <- i+7
    } else {
      stop(paste("unrecognized command", parts[i]))
    }
  }
  points
}
and you can run it with
path <- "M12.967,349.469c15.107-87.283,25.932-180.142,54.214-264.61c31.17-93.095,54.138,17.688,65.096,53.934c11.354,37.558,23.177,74.976,34.309,112.6c26.534,89.679,79.275-25.286,92.183-45.57c11.749-18.462,20.938-43.699,69.798-48.289c70.298-6.604,177.054-4.848,224.858-5.774"
pp <- parse_svg_path(path)
And if i plot that I get
plot(pp[1,], pp[2,], type="l")
# ggplot version:
# ggplot(data.frame(x=pp[1,], y=pp[2,])) + geom_path(aes(x,y))
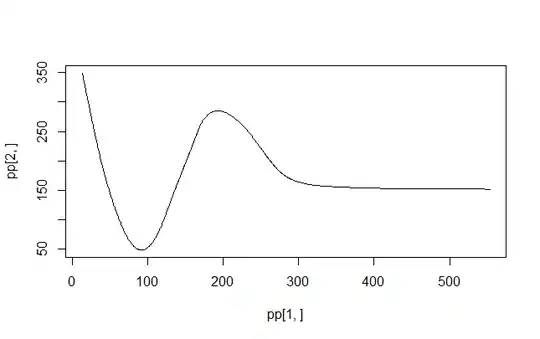
Which I hope is the right shape?
