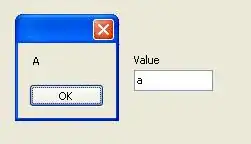
How can I add_trace in a loop when using a list of dataframes
I keep getting the following using code below
df1<-c(seq(1:32))
df2<-df*2
df3<-df2*8
dff1<-sqrt(df1)
dff2<-sqrt(df2)
dff3<-sqrt(df3)


a<-cbind.data.frame(df1,dff1)
b<-cbind.data.frame(df2,dff2)
c<-cbind.data.frame(df3,dff3)
colnames(a)<-c("df1","df2")
colnames(b)<-c("df1","df2")
colnames(c)<-c("df1","df2")

df<-list()
df[[1]]<-a
df[[2]]<-b
df[[3]]<-c

pl<-plot_ly()
for(i in 1:3){

  pl<- add_trace(pl,data=df[[i]],x=~df[[i]]$df1,y=~df[[i]]$df2,mode='lines',type='scatter')


}

pl
and when using lapply instead of for loops i get three seperate graphs instead of one graph with three lines
pl<-plot_ly()

pl<-lapply(1:3, function(i){

  pl<- pl%>%
    add_trace(data=df[[i]],x=~df[[i]]$df1,y=~df[[i]]$df2,mode='lines',type='scatter',inherit = TRUE)


})
pl
