11

Some seaborn methods like JointPlot create new figures on each call. This makes it impossible to create a simple animation like in matplotlib where iterative calls to plt.cla() or plt.clf() allow to update the contents of a figure without closing/opening the window each time.

The only solution I currently see is:

for t in range(iterations):
    # .. update your data ..

    if 'jp' in locals():
        plt.close(jp.fig)

    jp = sns.jointplot(x=data[0], y=data[1])
    plt.pause(0.01)

This works because we close the previous window right before creating a new one. But of course, this is far from ideal.

Is there a better way? Can the plot somehow be done directly on a previously generated Figure object? Or is there a way to prevent these methods to generate new figures on each call?

runDOSrun
  • 10,359
  • 7
  • 47
  • 57

2 Answers2

23

sns.jointplot creates a figure by itself. In order to animate the jointplot, one might therefore reuse this created figure instead of recreating a new one in each iteration.

jointplot internally creates a JointGrid, so it makes sense to directly use this and plot the joint axes and the marginals individually. In each step of the animation one would then update the data, clear the axes and set them up just as during creation of the grid. Unfortunately, this last step involves a lot of code lines.

The final code may then look like:

import matplotlib.pyplot as plt
import matplotlib.animation
import seaborn as sns
import numpy as np

def get_data(i=0):
    x,y = np.random.normal(loc=i,scale=3,size=(2, 260))
    return x,y

x,y = get_data()
g = sns.JointGrid(x=x, y=y, size=4)
lim = (-10,10)

def prep_axes(g, xlim, ylim):
    g.ax_joint.clear()
    g.ax_joint.set_xlim(xlim)
    g.ax_joint.set_ylim(ylim)
    g.ax_marg_x.clear()
    g.ax_marg_x.set_xlim(xlim)
    g.ax_marg_y.clear()
    g.ax_marg_y.set_ylim(ylim)
    plt.setp(g.ax_marg_x.get_xticklabels(), visible=False)
    plt.setp(g.ax_marg_y.get_yticklabels(), visible=False)
    plt.setp(g.ax_marg_x.yaxis.get_majorticklines(), visible=False)
    plt.setp(g.ax_marg_x.yaxis.get_minorticklines(), visible=False)
    plt.setp(g.ax_marg_y.xaxis.get_majorticklines(), visible=False)
    plt.setp(g.ax_marg_y.xaxis.get_minorticklines(), visible=False)
    plt.setp(g.ax_marg_x.get_yticklabels(), visible=False)
    plt.setp(g.ax_marg_y.get_xticklabels(), visible=False)


def animate(i):
    g.x, g.y = get_data(i)
    prep_axes(g, lim, lim)
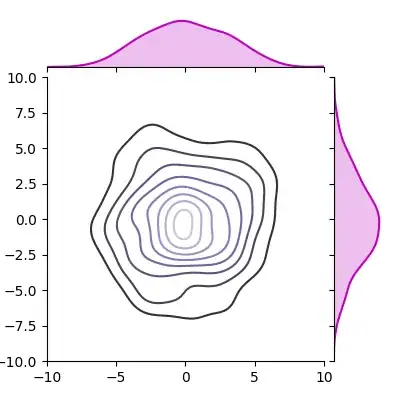
    g.plot_joint(sns.kdeplot, cmap="Purples_d")
    g.plot_marginals(sns.kdeplot, color="m", shade=True)

frames=np.sin(np.linspace(0,2*np.pi,17))*5
ani = matplotlib.animation.FuncAnimation(g.fig, animate, frames=frames, repeat=True)

plt.show()

enter image description here

Trenton McKinney
  • 56,955
  • 33
  • 144
  • 158
ImportanceOfBeingErnest
  • 321,279
  • 53
  • 665
  • 712
  • I was suspecting something like this. I wish it would be more straight-forward but this gets the job done nicely so thank you very much. – runDOSrun Sep 15 '17 at 11:31
  • From the source code of seaborn you would see that it has clearly not been written with the possibility of animating plots in mind. Depending on what the ultimate goal is, some optimizations may be done of course; I'm thinking in the direction of subclassing JointGrid to make it more susceptible to updates, putting that in a new module and calling it when needed - however that would only make sense if there is the need to do such animations more often. Also bear in mind that seaborn mostly wraps matplotlib, such that a solution might be to replicate what jointplot does purely with matplotlib. – ImportanceOfBeingErnest Sep 15 '17 at 11:37
  • can you please also illustrate for how to do in case of lmplot, I am unable to redraw – Parthiban Rajendran Jul 23 '18 at 06:43
  • @PaariVendhan This question asks about `JointGrid`, but essentially the concept is the same for other seaborn `*Grid`s as well. You would need to update the axes of the grid individually. – ImportanceOfBeingErnest Jul 23 '18 at 08:39
5

using the celluloid package (https://github.com/jwkvam/celluloid) I was able to animate seaborn plots without much hassle:

import numpy as np
from celluloid import Camera
import pandas as pd
import seaborn as sns
import matplotlib.pyplot as plt

fig = plt.figure()
camera = Camera(fig)

# animation draws one data point at a time
for i in range(0, data.shape[0]):
    plot = sns.scatterplot(x=data.x[:i], y=data.y[:i])
    camera.snap()

anim = camera.animate(blit=False)
anim.save('animation.mp4')

I'm sure similar code could be written for jointplots

Adam B
  • 3,662
  • 2
  • 24
  • 33
  • Turns out that contrary to their examples, saving functionality does not work in celluloid because it uses pillow to save, which does not support video formats. This code fails for me. – user2188329 Jun 18 '20 at 20:53
  • I think you need ffmpeg installed. – Adam B Jun 18 '20 at 20:56
  • Hey Adam. I found that specifying a writer works. For example: `anim.save('/home/blws1/Desktop/animated_gif.gif', writer='imagemagick')`. An animated gif was fine in my case. I tried using ffmpeg as the specified writer but couldn't get that to work for mp4. – user2188329 Jun 18 '20 at 21:42
  • Are you sure FFmpeg is installer properly? On Mac i had to install FFmpeg using homebrew then the above code worked fine – Adam B Jun 18 '20 at 21:56
  • Note that seaborn figure-level interfaces that create a new figure each time won't work with this. A workaround for e.g. histplot is to pre-make the axes and then pass the same ax to the seaborn function. – Max Oct 27 '20 at 15:54