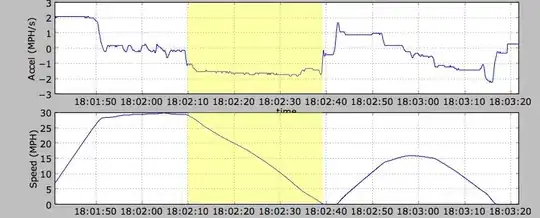
I am trying to plot some time intervals:
import matplotlib.pyplot as plt
plt.hlines(1,v1,v2)
myFmt = DateFormatter('%H:%M:%S')

ax.xaxis.set_major_formatter(myFmt)

ax.xaxis.set_major_locator(SecondLocator(interval=2000))
where
v1=numpy.datetime64('2017-09-13T05:12:56.089000000')
v2=numpy.datetime64('2017-09-13T11:51:30.089000000')
then I get:
 which is very nice.
However, for readibility I would like to have the ticks on the round hours e.g. 05.00, 06.00 ...
However, I still need to be accurate so I need to add in the plot the exact time of beginning and end with the same formatting.
A general solution would be great since I may need to repeat the tricks with months and so on..
