I had a similar problem - wanted to do segmentation of the time series on segments with a similar trends. For that task, you can use trend-classifier Python library. It is pip installable (pip3 install trend-classifier).
Here is an example that gets the time series data from YahooFinance and performs analysis.
import yfinance as yf
from trend_classifier import Segmenter

# download data from yahoo finance
df = yf.download("AAPL", start="2018-09-15", end="2022-09-05", interval="1d", progress=False)

x_in = list(range(0, len(df.index.tolist()), 1))
y_in = df["Adj Close"].tolist()

seg = Segmenter(x_in, y_in, n=20)
seg.calculate_segments()
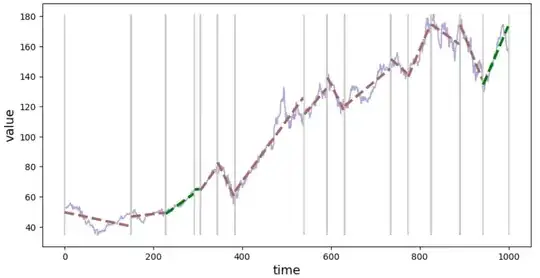
Now, you can plot the time series with trend lines and segment boundaries with:
seg.plot_segments()
You can inspect details about each segment (e.g. positive value for slope indicates up-trend and a negative down-trend). To see info about the segment with index 3:
from devtools import debug
debug(seg.segments[3])
You can have information about all segments in tabular form using Segmenter.segments.to_dataframe() method which produces Pandas DataFrame.
seg.segments.to_dataframe()
There is a parameter that controls the "generalization" factor, i.e. you can try to fit a trend line to a smaller range of time series - you will end up with a large number of segments, or you can go for the segments spanning a bigger part of the time series (more general trend line) and end up with a time series divided into fewer segments. To control that behavior, when initializing Segmenter() (e.g. Segmenter(x_in, y_in, n=20) use various values for n parameter. The larger n the generalization is stronger (fewer segments).
Disclaimer: I'm the author of the trend-classifier package.