2

This is similar question to this one How to use superscript with ggplot2

but instead of hard coded value of the label I have a string in variable and I need to append the "mm^3" to the string and display that in ggplot.

I have code like this:

genericPlot <- genericPlot + labs(y = wrap(ylab, wrap.length))

#' Wrap
#' 
#' @param x character, values to be wrapped
#' @param width numeric, max number of characters
#' 
#' @return Wrapped x
wrap <- function(x, width) {
  sapply(
    X = x, 
    FUN = function(x) paste(strwrap(x, width = width), collapse = "\n"))
}

I've tried to use this:

paste(ylab, bquote(~mm^3))

but this give me vector with 2 elements:

[1] "foo ~"    "foo mm^3"
pogibas
  • 27,303
  • 19
  • 84
  • 117
jcubic
  • 61,973
  • 54
  • 229
  • 402
  • 2
    Can you give a small reproducible example which demonstrates this appending? – Roman Luštrik Oct 19 '17 at 12:02
  • I second @RomanLuštrik comment (and pint to `help('plotmath')` or/and [tidyverse's Plotmath page on github](https://github.com/tidyverse/ggplot2/wiki/Plotmath)). – Eric Fail Oct 19 '17 at 12:11

2 Answers2

6

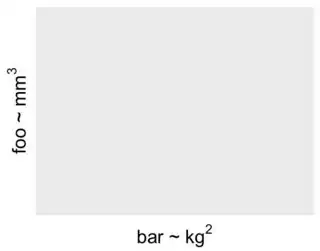
You were very close! Instead of using paste call your variable from bquote using .(VAR).

library(ggplot2)
ylab <- "foo"
myX  <- "bar" 
ggplot() + 
    ylab(bquote(.(ylab) *" ~ "* mm^3)) +
    xlab(bquote(.(myX) *" ~ "* kg^2))

enter image description here

pogibas
  • 27,303
  • 19
  • 84
  • 117
  • do you know how to make it work with wrap? if I call wrap before bquote I get `mm^3` aligned to top and big space and if I do wrap after bquote I've got `*` as label or something like that. – jcubic Oct 19 '17 at 14:59
1

I could not follow your case with the brief time available, but I have used the following code once to produce the output below

scale_y_continuous(trans="log10", breaks=ybreaks, name= expression(Discharge~~ or ~~ flow ~~ group("[",m^3/s, "]")))

enter image description here

Marco
  • 4,000
  • 3
  • 25
  • 26
  • what about if "Discharge" is a string in variable? – jcubic Oct 19 '17 at 12:25
  • better to have a look to this answer https://stackoverflow.com/questions/4973898/combining-paste-and-expression-functions-in-plot-labels – Marco Oct 19 '17 at 12:41