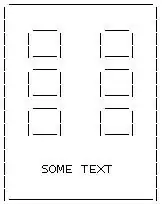
The problem you run into is that the text bounding box is expanded to host the complete rotated text, but that box itself is still defined in cartesian coordinates. The picture below shows two texts with horizontalalignment "left" and vertical alignment "bottom"; the problem is that the rotated text has its bounding box edge much further away from the text.
What you want is rather to have the text rotate about an edge point of its own surrounding as below.

This can be achieved using the rotation_mode="anchor" argument to matplotlib.text.Text, which steers exactly the above functionality.
ax.text(..., rotation_mode="anchor")
In this example:
from matplotlib import pyplot as plt
import numpy as np

lObjectsALLcnts = [1, 1, 1, 2, 2, 3, 5, 14, 15, 20, 32, 33, 51, 1, 1, 2, 2, 3, 3, 3, 3,
                   3, 4, 6, 7, 7, 10, 10, 14, 14, 14, 17, 1, 1, 1, 1, 2, 2, 2, 2, 3, 3,
                   5, 5, 6, 14, 14, 27, 27, 1, 1, 2, 3, 4, 4, 5]

lObjectsALLlbls = ['DuctPipe', 'Column', 'Protrusion', 'Tree', 'Pole', 'Bar', 'Undefined',
                   'EarthingConductor', 'Grooves', 'UtilityPipe', 'Cables', 'RainPipe', 'Moulding',
                   'Intrusion', 'PowerPlug', 'UtilityBox', 'Balcony', 'Lighting', 'Lock', 'Doorbell',
                   'Alarm', 'LetterBox', 'Grate', 'Undefined', 'CableBox', 'Canopy', 'Vent', 'PowerBox',
                   'UtilityHole', 'Recess', 'Protrusion', 'Shutter', 'Handrail', 'Lock', 'Mirror',
                   'SecuritySpike', 'Bench', 'Intrusion', 'Picture', 'Showcase', 'Camera',
                   'Undefined', 'Stair', 'Protrusion', 'Alarm', 'Graffiti', 'Lighting', 'Ornaments',
                   'SecurityBar',
                   'Grate', 'Vent', 'Lighting', 'UtilityHole', 'Intrusion', 'Undefined', 'Protrusion']

iN = len(lObjectsALLcnts)
arrCnts = np.array(lObjectsALLcnts)

theta=np.arange(0,2*np.pi,2*np.pi/iN)
width = (2*np.pi)/iN *0.9
bottom = 50

fig = plt.figure(figsize=(8,8))
ax = fig.add_axes([0.1, 0.1, 0.75, 0.75], polar=True)
bars = ax.bar(theta, arrCnts, width=width, bottom=bottom)

plt.axis('off')

rotations = np.rad2deg(theta)
for x, bar, rotation, label in zip(theta, bars, rotations, lObjectsALLlbls):
    lab = ax.text(x,bottom+bar.get_height() , label,
             ha='left', va='center', rotation=rotation, rotation_mode="anchor",)
plt.show()
Note that this uses the given 50 units of bottom spacing. You may increase this number a bit to have more spacing between bars and text.
The below initial version of this answer is somehow outdated. I will keep it here for reference.
The problem you run into is that the text bounding box is expanded to host the complete rotated text, but that box itself is still defined in cartesian coordinates. The picture below shows two texts with horizontalalignment "left" and vertical alignment "bottom"; the problem is that the rotated text has its bounding box edge much further away from the text.
An easy solution may be to define the horizontal and vertical alignment as "center", such the pivot of the text stays the same independent of its rotation.
The problem would then be to get a good estimate for the distance between the center of the text and the bar's top.
One could take half the number of letters in the text and multiply it with some factor. This would need to be found by trial and error.
bottom = 50
rotations = np.rad2deg(theta)
y0,y1 = ax.get_ylim()

for x, bar, rotation, label in zip(theta, bars, rotations, lObjectsALLlbls):
     offset = (bottom+bar.get_height())/(y1-y0)
     h =offset + len(label)/2.*0.032
     lab = ax.text(x, h, label, transform=ax.get_xaxis_transform(),
             ha='center', va='center')
     lab.set_rotation(rotation)
You could also try to find out how large the rendered text really is and use this information to find out the coordinates,
bottom = 50
rotations = np.rad2deg(theta)
y0,y1 = ax.get_ylim()

for x, bar, rotation, label in zip(theta, bars, rotations, lObjectsALLlbls):
     offset = (bottom+bar.get_height())/(y1-y0)
     lab = ax.text(0, 0, label, transform=None,
             ha='center', va='center')
     renderer = ax.figure.canvas.get_renderer()
     bbox = lab.get_window_extent(renderer=renderer)
     invb = ax.transData.inverted().transform([[0,0],[bbox.width,0] ])
     lab.set_position((x,offset+(invb[1][0]-invb[0][0])/2.*2.7 ) )
     lab.set_transform(ax.get_xaxis_transform())
     lab.set_rotation(rotation)

Complete code for reproduction:
import numpy as np
import matplotlib.pyplot as plt

lObjectsALLcnts = [1, 1, 1, 2, 2, 3, 5, 14, 15, 20, 32, 33, 51, 1, 1, 2, 2, 3, 3, 3, 3,
               3, 4, 6, 7, 7, 10, 10, 14, 14, 14, 17, 1, 1, 1, 1, 2, 2, 2, 2, 3, 3,
               5, 5, 6, 14, 14, 27, 27, 1, 1, 2, 3, 4, 4, 5]

lObjectsALLlbls = ['DuctPipe', 'Column', 'Protrusion', 'Tree', 'Pole', 'Bar', 'Undefined',
               'EarthingConductor', 'Grooves', 'UtilityPipe', 'Cables', 'RainPipe', 'Moulding',
               'Intrusion', 'PowerPlug', 'UtilityBox', 'Balcony', 'Lighting', 'Lock', 'Doorbell',
               'Alarm', 'LetterBox', 'Grate', 'Undefined', 'CableBox', 'Canopy', 'Vent', 'PowerBox',
               'UtilityHole', 'Recess', 'Protrusion', 'Shutter', 'Handrail', 'Lock', 'Mirror',
               'SecuritySpike', 'Bench', 'Intrusion', 'Picture', 'Showcase', 'Camera',
               'Undefined', 'Stair', 'Protrusion', 'Alarm', 'Graffiti', 'Lighting', 'Ornaments',
               'SecurityBar',
               'Grate', 'Vent', 'Lighting', 'UtilityHole', 'Intrusion', 'Undefined', 'Protrusion']

iN = len(lObjectsALLcnts)
arrCnts = np.array(lObjectsALLcnts)

theta=np.arange(0,2*np.pi,2*np.pi/iN)
width = (2*np.pi)/iN *0.9
bottom = 50

fig = plt.figure(figsize=(8,8))
ax = fig.add_axes([0.1, 0.1, 0.75, 0.75], polar=True)
bars = ax.bar(theta, arrCnts, width=width, bottom=bottom)

plt.axis('off')

rotations = np.rad2deg(theta)
y0,y1 = ax.get_ylim()

for x, bar, rotation, label in zip(theta, bars, rotations, lObjectsALLlbls):
 offset = (bottom+bar.get_height())/(y1-y0)
 lab = ax.text(0, 0, label, transform=None,
         ha='center', va='center')
 renderer = ax.figure.canvas.get_renderer()
 bbox = lab.get_window_extent(renderer=renderer)
 invb = ax.transData.inverted().transform([[0,0],[bbox.width,0] ])
 lab.set_position((x,offset+(invb[1][0]-invb[0][0])/2.*2.7 ) )
 lab.set_transform(ax.get_xaxis_transform())
 lab.set_rotation(rotation)


plt.show()
Unfortunately there is again some strange factor 2.7 involved. Even more unfornate is that in this case I have absolutely no idea why it must be there. But the result may still be good enough to work with.
One could also use a solution from ths question: Align arbitrarily rotated text annotations relative to the text, not the bounding box