I've been trying to plot a shapefile using sf package plot function but I get this:
(The shapefile can be found here: https://drive.google.com/open?id=1AKMP9i549xESStN-R59UUU80OmkXy1XM)
sf <- st_read('fisiografia_cortado_disolve_gapis_des.shp')
plot(sf, lty = 0)
I can't display the key correctly. I've been playing with par function but I think I'm doing all wrong because nothing changes.
I tried:
par(mar = c(10,10,10,20))
and many other combinations (c(10,5,5,20), c(10,10,10,10)) but I think sf plots doesn't rely on par settings (forgive if I'm wrong).
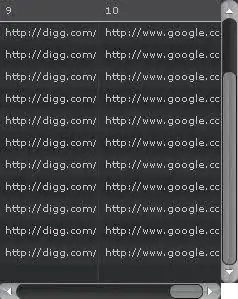
I also tried to use the key.size attribute within the plot function but it only changes the width of the key (see the left image below) and if it is too big only the key is shown (right).
plot(sf, lty = 0, key.size = 1)
plot(sf, lty = 0, key.size = 10)

I'd like to show correctly the key and, if possible, change its size.
Anyone has gone through the same problem?

