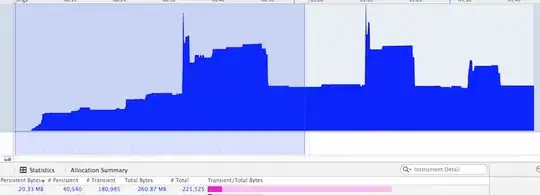
Let's take the example below:
krispo.github.io/angular-nvd3/#/lineChart
I want to add more space (kind of padding) between the min/max of the line chart and the x-axis/top.
There is this an option called yDomain:
Defines the whole Y scale's domain. Using this will disable calculating the domain based on the data.
The bold part means if I set the min to be -100, if my chart goes below that level, I won't see it anymore. Or, if the min of my chart is actually -50, then -100 would be too much.
So basically I want the min and the max of the Y-Axis to be 10% of the (respectively) min and max of the chart.
