The way label text is represented in my .graphml file is different from how yEd encodes and expect label information. So yEd doesn't pick it up automatically. I need to set the properties manually in order to display the labels.
- Open the .graphml in yEd
- Change the layout from the menu bar Layout -> (type of layout)
one drawback is yEd can't automatically detect the layout of the graph. However my file does not contain any layout information at all, anyways. My graph is undirected but yEd interprets it as directed. That is because by default yEd is directed. So if it's undirected we need to select one edge press ctrl+A to select all the nodes, then go to properties view and change the "Source Arrow" and "Target Arrow" properties.
- Set up a custom property for nodes and/or edges by Edit (in menu bar) -> Manage Custom Properties
- Apply the custom property for nodes and/or edges by Edit (in menu bar) -> Properties Mapper
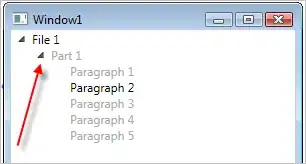
Final output looks like below. This article provides a detailed explanation on how to do the mapping manually.
 I would like to thank Mr.Thomas from yED who helped me figure this out.
Also Gephi is another free software that we can use to view .graphml files. Reading graphml is not a default feature in Gephi. During the installation we need to specify (tick the checkbox) indicating we want to read .graphml files. However I think Gephi is more straightforward than yEd.


