Edited to provide reproducible example.
Sample data: https://owncloud.cesnet.cz/index.php/s/oopPE2Ut4quSVOK
Having this data
> head(df)
  Sample_Name        E Sentrix_ID Sentrix_ID_full
1    P129C1S1 5.636927 5058818037    5058818037_A
2    P129C1S1 5.794948 5058818037    5058818037_A
3    P129C1S1 5.608488 5058818037    5058818037_A
4    P129C1S1 5.989108 5058818037    5058818037_A
5    P129C1S1 5.570090 5058818037    5058818037_A
6    P129C1S1 5.555401 5058818037    5058818037_A
I am generating horizontal boxplots by
library(ggplot2)
library(ggthemes)

df <- read.csv("sample.csv")
df$Sentrix_ID <- as.factor(df$Sentrix_ID)
df$Sentrix_ID_full <- as.factor(df$Sentrix_ID_full)

head(df)

p <- ggplot(data = df,
            aes(y = E, x = Sentrix_ID_full, color = Sentrix_ID, label = Sample_Name)) +
  geom_boxplot(outlier.shape = NA) +
  scale_colour_manual(values = c("5058818037" = "red", "5226121006" = "green")) +
  theme_few() +
  guides(colour = FALSE) +
  labs(x = "Sentrix ID", y = "E", title = "intensity values") +
  coord_flip()

p
I want to add label to each boxplot:
p <- p + geom_text()
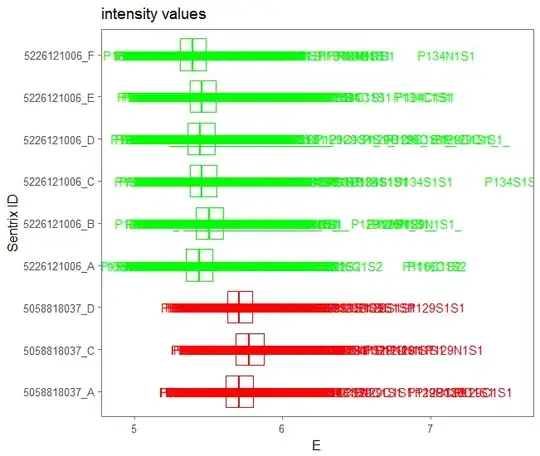
But this happens:
Is there any solution? Thank you in advance :)


