0

We're experiencing memory leaks in our Xamarin.Forms Android application, and I've been investigating using Profiler. This has led me to running Profiler against a very basic Forms app.

The very basic Forms app is based on the simple List->Detail template project which is available in Visual Studio For Mac.

All it does is navigate from a list page to a details page using the inbuilt navigation stack.

    async void OnItemSelected(object sender, SelectedItemChangedEventArgs args)
    {
        var item = args.SelectedItem as Item;
        if (item == null)
            return;

        await Navigation.PushAsync(new ItemDetailPage(new ItemDetailViewModel(item)));

        // Manually deselect item
        ItemsListView.SelectedItem = null;
    }

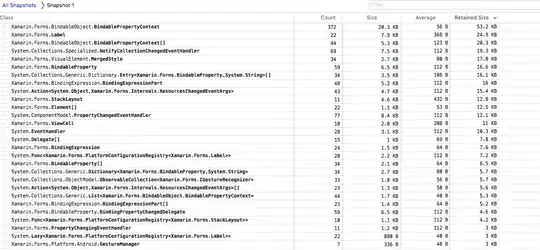
Going from List->Details->List 11 times and then taking a snapshot in Profiler reveals that we've got 372 BindablePropertyContext objects and 22 Labels (among other objects) created and not released:

I have tried setting Content to null and BindingContext to null in the OnDisappearing event of the Details page, and also putting an explicit GC.Collect() in the OnAppearing of the List page. Neither of these fix the problem.

This is not acceptable for an app which is intended to run continuously on a device!

So is there a core memory leak in Forms, or am I missing something?

I'm using Xamarin.Forms 2.5.0.121934

James Lavery
  • 920
  • 4
  • 25
  • If you initialize the pages every time you click on the item with `new ItemDetailPage(new ItemDetailViewModel(item))` you are creating more and more objects. In this case if you don't reach the heap limit, those objects remain in memory and the GC is not wasting time removing them – MatPag Dec 13 '17 at 15:22
  • @MatPag very good point, which had occurred to me. Can I coerce the app to reduce its heap limit, to check that they will be freed when they need to? – James Lavery Dec 13 '17 at 15:27
  • I don't think you can lower the HEAP space and there is no predefined value (this depends on the OEM and the device hardware). Try to put your initilization in a big for cycle and you should notice (if there are no real leaks) that when you are near to reach the limit, the objects count won't increase more – MatPag Dec 13 '17 at 15:33
  • Yes, that's what I'd concluded. I'll create some large objects to munch up memory, and then watch to see if these UI artefacts are freed. – James Lavery Dec 13 '17 at 15:35
  • Has your UI thread been stuck? If your UI thread works well, and there is no `ANT`,I think you shouldn't be care of it, because it is normal,the heap memory will be cleaned by `CLR`. – Robbit Dec 14 '17 at 06:50

1 Answers1

0

Running this on a less powerful device (i.e. with less memory) showed that these objects were in fact GC'd, and so there is in fact no problem, and no leak.

James Lavery
  • 920
  • 4
  • 25