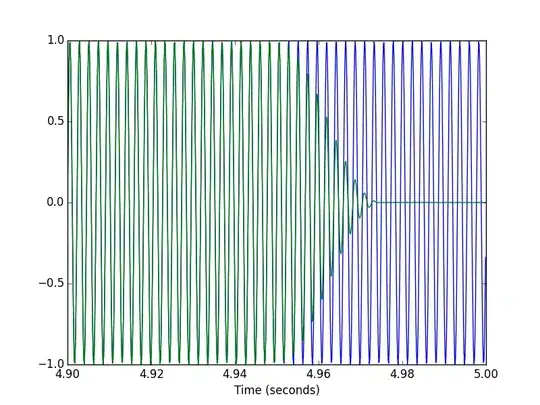
Hi I have created a linear model and a regression plot - However, I would like to have the model results on the plot itself - something like the image below:

How do I show the key results on the plot? Below is my code for the plot:
library(ggplot2)
ggplot(HP_crime15, aes (x = as.numeric(HP_crime15$Theft15), y =
as.numeric(HP_crime15$X2015))) + geom_point(shape=1) +
geom_smooth(method=lm) + xlab ("Recorded number of Thefts") +
ylab("House prices (£)") + ggtitle("Title")

