3

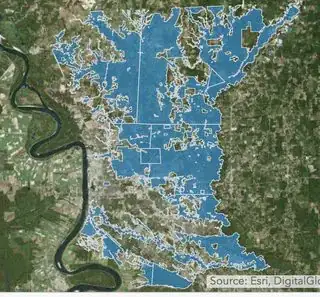
I am trying to plot a *.shp file available here ArcGis. Looking at the page where I took the data from, I would expect the colored area to look like this:

the map how I would expect it to be.

But when I plot it I get something different (see below). In particular, it seems that some polygons overlap, and some areas are filled with a double layer of blue (alpha is .5), while they should be empty.

library(ggmap)
brMap <- qmap(location = 'baton rouge',  zoom = 10, maptype = 'terrain') 

library(rgdal)
indundationArea <- readOGR('dataset/Estimated_Flood_Inundation_Area/Estimated_Flood_Inundation_Area.shp')
ogrInfo('dataset/Estimated_Flood_Inundation_Area/Estimated_Flood_Inundation_Area.shp')
indundationArea <- spTransform(indundationArea, CRS("+proj=longlat +datum=WGS84"))
indundationArea <- fortify(indundationArea)

brMap +
  geom_polygon(aes(x=long, y=lat, group=group), size=.2,color='blue', fill = 'blue', alpha=.5, data=indundationArea)
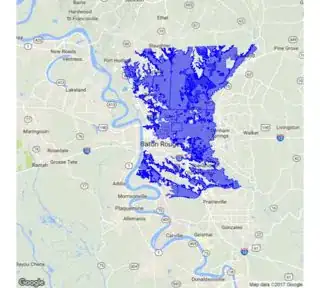
enter image description here

loki
  • 9,816
  • 7
  • 56
  • 82
Dambo
  • 3,318
  • 5
  • 30
  • 79
  • If it was a duplicate, should zooming out solve the issue? It doesn't for me. Also, part of the code in the answer gives an error: `get_map("new york city", zoom = 10, source = "stamen")` – Dambo Dec 21 '17 at 16:13
  • 1
    You should provide a reproducible example not the code that you ran with the data that you have. Read about how to provide a [reproducible example](https://stackoverflow.com/questions/5963269/how-to-make-a-great-r-reproducible-example). p.s. this is a potentially good question. – M-- Dec 21 '17 at 16:41
  • @Masoud the data is available at the link I gave, which is a zip file. Is there a function to unzip from an url and pass a single file from the unzipped folder? – Dambo Dec 21 '17 at 16:47
  • https://stackoverflow.com/questions/3053833/using-r-to-download-zipped-data-file-extract-and-import-data – M-- Dec 21 '17 at 16:49
  • 2
    What is the issue with what you get as output from ggmap? What are you expecting? If you want something that looks exactly like your first image, you have to adjust the zoom level and use a different basemap. – dshkol Dec 21 '17 at 18:11
  • @dshkol it's not about the base map, it seems that all the darker light-blue area in the second map should be empty. – Dambo Dec 22 '17 at 08:37

1 Answers1

4

Your problem is caused by polygons with holes. geom_polygon is currently not able plot these correctly. Therefore, you should use ggpolypath::geom_polypath like this:

# continue after fortify
library(ggpolypath)
brMap +
  geom_polypath(data = indundationArea, 
               aes(x=long, y=lat, group=group), 
               size=.2,
               color='blue', 
               fill = 'blue', 
               alpha=.5) 

enter image description here

Another option might be this one. However, it did not work for me...

loki
  • 9,816
  • 7
  • 56
  • 82