13

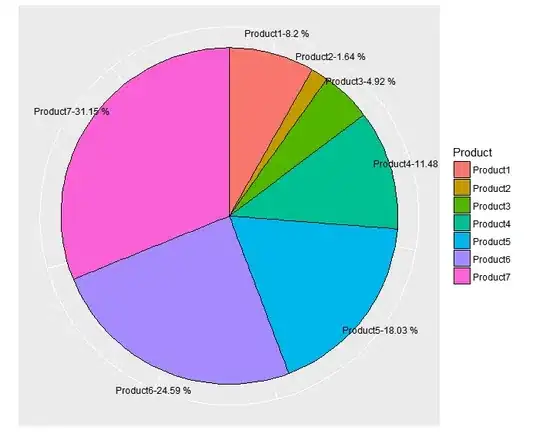
How can I put the label outside the pie chart So that labels will be in the proper place?

Product <- c("Product1","Product2","Product3","Product4","Product5","Product6","Product7")
Value <- c(1000000,200002,599996,1399994,2199992,2999990,3799988)
df <- data.frame(Product,Value)
df$Label <- paste(Product, paste(round(((df$Value/sum(df$Value))*100),2),"%"), sep="-")

library(ggplot2)

p <-  ggplot(df, aes(x = 1, y = Value, fill = Product)) + geom_bar(stat = "identity")
p <- p + coord_polar(theta = 'y') + theme_void()
p <- p + geom_text(aes(label = Label), position = position_stack(vjust = 0.5))

enter image description here

Jaap
  • 81,064
  • 34
  • 182
  • 193
Let's Yo
  • 335
  • 1
  • 3
  • 11

3 Answers3

22

Using:

library(dplyr)
df <- df %>% 
  mutate(end = 2 * pi * cumsum(Value)/sum(Value),
         start = lag(end, default = 0),
         middle = 0.5 * (start + end),
         hjust = ifelse(middle > pi, 1, 0),
         vjust = ifelse(middle < pi/2 | middle > 3 * pi/2, 0, 1))

library(ggforce) # for 'geom_arc_bar'
ggplot(df) + 
  geom_arc_bar(aes(x0 = 0, y0 = 0, r0 = 0, r = 1,
                   start = start, end = end, fill = Product)) +
  geom_text(aes(x = 1.05 * sin(middle), y = 1.05 * cos(middle), label = Label,
                hjust = hjust, vjust = vjust)) +
  coord_fixed() +
  scale_x_continuous(limits = c(-1.5, 1.5),  # Adjust so labels are not cut off
                     name = "", breaks = NULL, labels = NULL) +
  scale_y_continuous(limits = c(-1, 1.1),    # Adjust so labels are not cut off
                     name = "", breaks = NULL, labels = NULL)

gives:

enter image description here

Jaap
  • 81,064
  • 34
  • 182
  • 193
  • 1
    Many Thanks! That's what I want ! – Let's Yo Jan 10 '18 at 10:15
  • @Let'sYo Glad I could help. You could also use baseplotting to achieve that, [see here for an example](https://stackoverflow.com/a/23984219/2204410) – Jaap Jan 10 '18 at 10:19
  • Thanks for your addition information... i just spend hours to find out putting the label outside the pie chart but there is not much useful link for me to go through maybe it's because my bad key-words anyway thanks again! – Let's Yo Jan 10 '18 at 10:22
  • Hm, where is the label for Product1? – untill Apr 11 '21 at 15:20
  • 1
    @untill Thx for spotting. I adjusted the limits in the `scale_*_continuous` functions a bit; now all labels fit in the plot. See the update. – Jaap Apr 11 '21 at 21:04
3

Besides solution by @Jaap, it can also be achieved adding theme and scale_y_continuous to you basic plot p.

p <- ggplot(df,aes(x=1,y=Value,fill=Product))+geom_bar(stat="identity", color = "black")

p <- p + coord_polar(theta='y')+ theme(axis.ticks=element_blank(),
                                       axis.text.y=element_blank(),
                                       axis.text.x=element_text(colour='black'),
                                       axis.title=element_blank())
p <- p + scale_y_continuous(breaks=cumsum(df$Value) - df$Value / 2, labels= df$Label)

The Result is as following : pe-plot

parth
  • 1,571
  • 15
  • 24
2

I tried to include the label for product 1 in @Jaap's code. I changed x and y value in the geom_text and it worked. Everything else in the code is the same.

geom_text(aes(x = 1 * sin(middle), y = 1 * cos(middle), label = Label,
            hjust = hjust, vjust = vjust))
Ibis_Q
  • 21
  • 2