I spent a lot of time trying to find a solution for my stupid problem but I didn't manage to do it. I'm a newbie in Python (and in plotting above all).
What I would like to do is to plot a small legend for my datapoint. I have a 2-dimensional dataset with a class [0,1,2] for each entry. This is the code I wrote for plotting my dataset:
plt.figure(figsize=(15,8))
plt.scatter(reduced_dataset[:,0], reduced_dataset[:,1], c=y.Gender)
plt.xlabel('PC 1')
plt.ylabel('PC 2')
plt.legend()
plt.figure()
So, what I want is first of all to know which class the three colours represent and to add a small legend on the top right explaining this.
Edit: I add some details. My dataset, called reduced_dataset is a 2-dimensional dataset like this, obtained from a 8-dimensional dataset by the application of PCA (n_components=2):
[[5.29251,-0.680271]
[-10.6902,0.135495]
[-0.676506,-0.0493725]
[0.306184,-0.315342]
[-2.73479,-0.705164]]
and I have a vector that represents the classes for each row of my dataset:
[0,0,1,0,2]
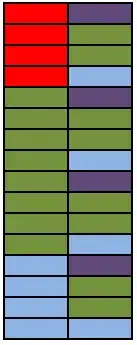
So the class could be 1, 2 or 3, that's why I have three color for the datapoints in my plot. I would need a legend like this:
Thank you.

