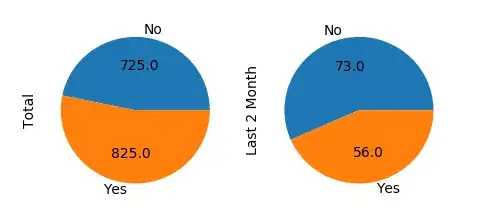
A hacky solution would be to index the dataframe within the absolute_value function, considering that this function is called exactly once per value in that dataframe.
import matplotlib.pyplot as plt
import numpy as np
import pandas as pd

d = {'Yes':pd.Series([825, 56], index=["Total", "Last 2 Month"]),
     'No':pd.Series([725, 73], index=["Total", "Last 2 Month"])}
df = pd.DataFrame(d)
df = df.T

i = [0]
def absolute_value(val):
    a  = df.iloc[i[0]%len(df),i[0]//len(df)]
    i[0] += 1
    return a

df.plot.pie(subplots=True, figsize=(12, 6),autopct=absolute_value)
plt.show()
The other option is to plot the pie charts individually by looping over the columns.
import matplotlib.pyplot as plt
import numpy as np
import pandas as pd

d = {'Yes':pd.Series([825, 56], index=["Total", "Last 2 Month"]),
     'No':pd.Series([725, 73], index=["Total", "Last 2 Month"])}
df = pd.DataFrame(d)
df = df.T
print df.iloc[:,0].sum()

def absolute_value(val, summ):
    a  = np.round(val/100.*summ,0)
    return a

fig, axes = plt.subplots(ncols=len(df.columns))
for i,ax in enumerate(axes):
    df.iloc[:,i].plot.pie(ax=ax,autopct=lambda x: absolute_value(x,df.iloc[:,i].sum()))
plt.show()
In both cases the output would look similar to this

