10

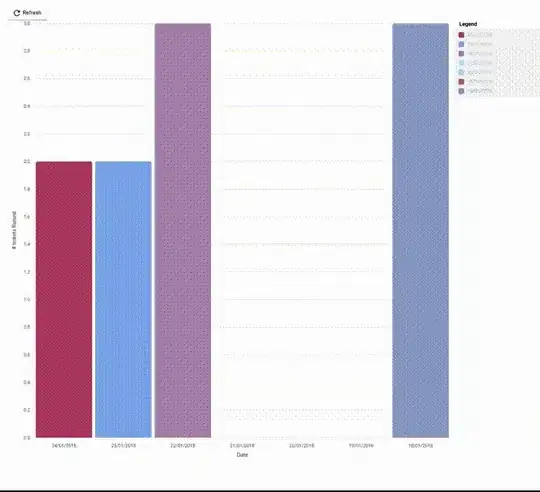
I'm building an app using Swimlane's Ngx Charts for graphical data representation, but I'm getting odd behaviour when I update the data via a refresh button which re-calls a GET function to update the data array. I'm using @angular/flex-layout for a "tile-like" view but even without using it, I'm still encountering this issue - it just grows the parent container. I don't want to use hard-coded px values in the [view] property because I want it to work with any size of graph/tile.

I'm use a pretty basic vertical bar chart:

<div>
    <div>
        <ngx-charts-bar-vertical [results]="dataArray"
                                 [legend]="true"
                                 [xAxis]="true"
                                 [yAxis]="true"
                                 [xAxisLabel]="'Date'"
                                 [yAxisLabel]="'# tickets Raised'"
                                 [showXAxisLabel]="true"
                                 [showYAxisLabel]="true"></ngx-charts-bar-vertical>
    </div>
    <div>
        <!-- Got a table here -->
    </div>
</div>

To update my dataArray I'm doing:

export class DashboardComponent implements AfterViewInit {
    constructor(private httpClient: HttpClient, private datePipe: DatePipe, private dataService: DataService) { }

    dataArray: any[] = [];

    getData(): void {

        this.dataService.getSomeData<any[]>().subscribe(d => {
                this.dataArray = d;
        });
    }

    // Init
    ngAfterViewInit(): void {
        this.getData();
    }
}

On initial load, it's fine and will fill the container (where it can) but when I hit the refresh button this is the behaviour I get: enter image description here
Thank you for your time.

Matt Brewerton
  • 866
  • 1
  • 6
  • 23

5 Answers5

5

We solved it using a div around the chart and using CSS added a height of 40 or 50vh.

The chart no longer changes in height on update.

drinu16
  • 775
  • 2
  • 11
  • 25
1

The following worked for me:

<div style="max-height: 50vh">
  <ngx-charts-bar-vertical   [results]="dataArray"
                             [legend]="true"
                             [xAxis]="true"
                             [yAxis]="true"
                             [xAxisLabel]="'Date'"
                             [yAxisLabel]="'# tickets Raised'"
                             [showXAxisLabel]="true"
                             [showYAxisLabel]="true"></ngx-charts-bar-vertical>
</div>

Downside on this, is you would need to define a maximum height.

Prom0
  • 19
  • 3
0

Use views

<ngx-charts-bar-vertical [results]="dataArray"
                                 [legend]="true"
                                 [xAxis]="true"
                                 [yAxis]="true"
                                 [xAxisLabel]="'Date'"
                                 [yAxisLabel]="'# tickets Raised'"
                                 [showXAxisLabel]="true"
                                 [showYAxisLabel]="true" [view]="chartSize">
</ngx-charts-bar-vertical>

and in the component define chartSize

chartSize = [770, 450];
Sree
  • 921
  • 2
  • 12
  • 31
0

The attribute view will set the size and stop the change

  <ngx-charts-line-chart
    [results]="sloGraphData"
    [xAxis]="true"
    [yAxis]="true"
    [legend]="true"
    [legendPosition]="'below'"
    [showXAxisLabel]="false"
    [showYAxisLabel]="false"
    [showRefLines]="true"
    [referenceLines]="refLines"
    [xAxisLabel]="'Days required'"
    [yAxisLabel]="'Date'"
    [view]="[360, 300]">
  </ngx-charts-line-chart>
Deepesh Nair
  • 330
  • 5
  • 6
0

you trying to modify data is not recognized by change detection.

this.dataArray = d;

instead try spreading data over, that will detect the changes. It worked for me.

this.dataArray = [...d];
Thanan_Jaje
  • 109
  • 6