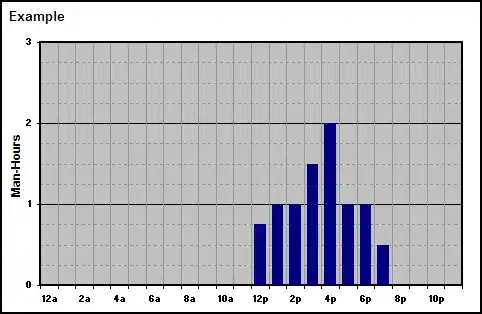
Well, Python has a built-in function called "set()" and you could use it on your "Y" array so that the numbers in it won't get repeated.
That of course, won't help you if the numbers are similar yet not the same (I.e. 4.4 and 4.5).
In that case you might want to consider making your graph bigger and adding more space between each unit on the scale.
The size of the plot can be changed by setting the dynamic rc settings of Matplotlib. These are stored in a dictionary named rcParams. The size of the plot figure is stored with the key figure.figsize.
As an example, to get and set the size of a Matplotlib plot:
import matplotlib.pyplot as plt

# Get current size
fig_size = plt.rcParams["figure.figsize"]

# Prints: [8.0, 6.0]
print "Current size:", fig_size

# Set figure width to 12 and height to 9
fig_size[0] = 12
fig_size[1] = 9
plt.rcParams["figure.figsize"] = fig_size
