5

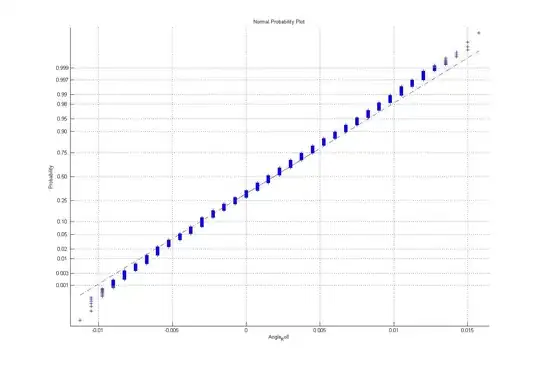
I have a very basic question. What is the basis of the normal probability plot i.e. what do the probabilities represent? I am testing for a standard normal distribution. My normplot (in MATLAB) revealed that the values were more or less in a straight line BUT the probability of 0.5 corresponded to a value other than zero.

My question is, how do I interpret this? Does this mean that my data is normally distributed but has a non-zero mean (i.e. not standard normal) or does this probability only reflect something else? I tried Google and one link said the probabilities are the cumulative probabilities from the z-table, and I can't figure out what to make of it.

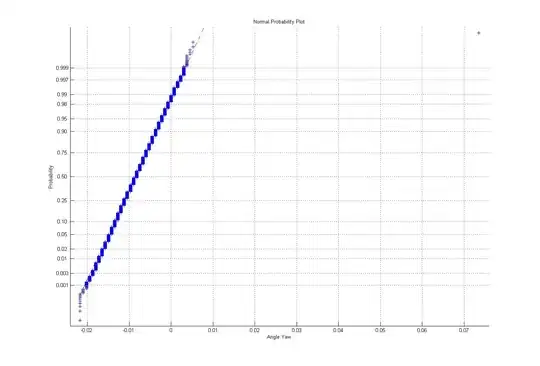
Also in MATLAB, is it that as long as the values are fitting into the line drawn by the program (the red dotted line) the values come from a normal distribution? In one of my graphs, the dotted line is very steep but the values fit in, does this mean that the one or two values that are way outside this line are just outliers?

I'm very new to stats, so please help!

Thanks!

zellus
  • 9,617
  • 5
  • 39
  • 56
Imelza
  • 301
  • 1
  • 7
  • 19

2 Answers2

2

My question is, how do I interpret this? Does this mean that my data is normally distributed but has a non-zero mean (i.e. not standard normal) or does this probability only reflect something else?

You are correct. If you run normplot and get data very close to the fitted line, that means your data has a cumulative distribution function that is very close to a normal distribution. The 0.5 CDF point corresponds to the mean value of the fitted normal distribution. (Looks like about 0.002 in your case)

The reason you get a straight line is that the y-axis is nonlinear, and it's made to be "warped" in such a way that a perfect Gaussian cumulative distribution would map into a line: the y-axis marks are linear with the inverse error function.

When you look at the ends and they have steeper slopes than the fitted line, that means your distribution has shorter tails than a normal distribution, i.e. there are fewer outliers, perhaps due to some physical constraint that prevents excessive variation from the mean.

Jason S
  • 184,598
  • 164
  • 608
  • 970
0

The normal distribution is a density function. The probability of any single value will be 0. This because you have the total probability ( = 1) distributed between an infinite number of values (its a continuous function).

What you have there in the graph (of the normal distribution) is how the probability is distributed (y axis) around the values (x axis). So what you can get from the graph is the probability of an interval either between 2 points, from -infinite to any point, or from any point to +infinte. This probability is obtained integrating the function (of the normal distribution) defined from point1 to point2.

But you don't have to do this integral since you have the z table. The z table gives you the probability of x being between -infinite and x (aplying the equation that relates x to z)

I don't have matlab here, but i guess the straight line you mention is the cumulative distribution function, which tells you the probability of x between [-infinite, x], and is determined by the sum (or integral in this case) from -infinite to the value of x (or obtained in the z table)

Sorry if my english was bad. I hope i was helpful.

Andre85
  • 469
  • 4
  • 10
  • okay, so why is it a straight line? For a gaussian the cumulative sum would be increasing from -infinity to the mean and then it would continue to increase at a decreasing rate right? (Because of the bell shape) I dont understand how to interpret my graph! I have attached it to my question – Imelza Feb 01 '11 at 05:20
  • check the shape of the cumulative distribution at http://psychology.wikia.com/wiki/Normal_distribution – Andre85 Feb 01 '11 at 05:39
  • 1
    -1: This is not a plot of the cumulative distribution. You may notice that the y-values are unevenly spaced. The normality plot is a "warped" cumulative plot, where the y-values are spaced such that a normal distribution (with the same mean and standard deviation as the input data) results in a straight line. This allows easy identification of deviations of the input from normality. – Jonas Feb 01 '11 at 19:50
  • When i answered the question there was no image attached to it. Would you be able to tell that only from his question? – Andre85 Feb 01 '11 at 21:28