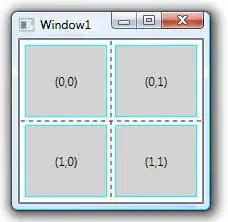
I have a set of 150x150px png images, and a set of (x, y) coordinates that they correspond to. Is there a way to plot the images on a grid? For example, I'm looking for an R or Python solution to create something like the following:
Asked
Active
Viewed 1.5k times
28
-
Related: http://stackoverflow.com/questions/11487797/python-matplotlib-basemap-overlay-small-image-on-map-plot – 0 _ Jun 06 '15 at 21:32
5 Answers
30
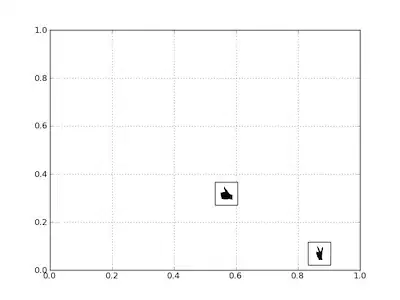
You create a bounding box by instantiating AnnotationBbox--once for each image that you wish to display; the image and its coordinates are passed to the constructor.
The code is obviously repetitive for the two images, so once that block is put in a function, it's not as long as it seems here.
import matplotlib.pyplot as PLT
from matplotlib.offsetbox import AnnotationBbox, OffsetImage
from matplotlib._png import read_png

fig = PLT.gcf()
fig.clf()
ax = PLT.subplot(111)

# add a first image
arr_hand = read_png('/path/to/this/image.png')
imagebox = OffsetImage(arr_hand, zoom=.1)
xy = [0.25, 0.45]               # coordinates to position this image

ab = AnnotationBbox(imagebox, xy,
    xybox=(30., -30.),
    xycoords='data',
    boxcoords="offset points")
ax.add_artist(ab)

# add second image
arr_vic = read_png('/path/to/this/image2.png')
imagebox = OffsetImage(arr_vic, zoom=.1)
xy = [.6, .3]                  # coordinates to position 2nd image

ab = AnnotationBbox(imagebox, xy,
    xybox=(30, -30),
    xycoords='data',
    boxcoords="offset points")
ax.add_artist(ab)

# rest is just standard matplotlib boilerplate
ax.grid(True)
PLT.draw()
PLT.show()
doug
- 69,080
- 24
- 165
- 199
17
One way to do it in R (2.11.0 and higher):
library("png")
# read a sample file (R logo)
img <- readPNG(system.file("img", "Rlogo.png", package="png"))
# img2 <- readPNG(system.file("img", "Rlogo.png", package="png"))
img2 <- readPNG("hand.png", TRUE) # here import a different image
if (exists("rasterImage")) {
  plot(1:1000, type='n')
  rasterImage(img, 100, 100, 200, 200)
  rasterImage(img2, 300, 300, 400, 400)
}
see ?readPNG and ?rasterImage for details.

Paolo
- 2,795
- 1
- 20
- 23
3
Also in R you can use the my.symbols and ms.image functions in the TeachingDemos package.
Greg Snow
- 48,497
- 6
- 83
- 110
1
In R, readed in the help(rasterImage):
require(grDevices)
#set up the plot region:
op <- par(bg = "thistle") <h>
plot(c(100, 250), c(300, 450), type = "n", xlab="", ylab="")
image <- as.raster(matrix(0:1, ncol=5, nrow=3))
rasterImage(image, 100, 300, 150, 350, interpolate=FALSE)
rasterImage(image, 100, 400, 150, 450)
rasterImage(image, 200, 300, 200 + xinch(.5), 300 + yinch(.3), interpolate=FALSE)
rasterImage(image, 200, 400, 250, 450, angle=15, interpolate=FALSE)
par(op)
....is a nice example.