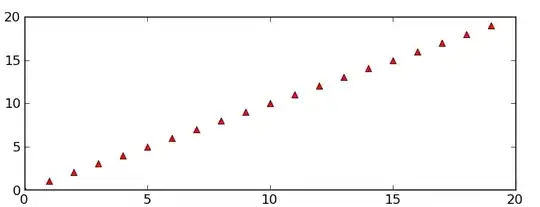
I am trying to put a small plot into a DT::dataTableOutput in shiny and while I can put a plot into a tableOutput with no problem, it doesn't display at all in the DT version.
library(shiny)
ui <- fluidPage(
  DT::dataTableOutput("data1"),
  tableOutput("data2")
)

server <- function(input, output) {
  output$data1 <- DT::renderDataTable({
    dat <- cars[1:5,]
    dat$test <- c("a","b","c","d",
      '<div id="testPlot1" class="shiny-plot-output" style="width: 100px ; height: 100px"></div>')
    dat
  },escape=FALSE)
  output$data2 <- renderTable({
    dat <- cars[1:5,]
    dat$test <- c("a","b","c","d",
      '<div id="testPlot2" class="shiny-plot-output" style="width: 100px ; height: 100px"></div>')
    dat
  }, sanitize.text.function = function(x) x)
  output$testPlot1 <- renderPlot({
    par(mar=c(0,0,0,0))
    plot(cars[[1]],cars[[2]])
  },height=100,width=100)
  output$testPlot2 <- renderPlot({
    par(mar=c(0,0,0,0))
    plot(cars[[1]],cars[[2]])
  },height=100,width=100)
  outputOptions(output, 'testPlot1', suspendWhenHidden=FALSE)
}

shinyApp(ui, server)

