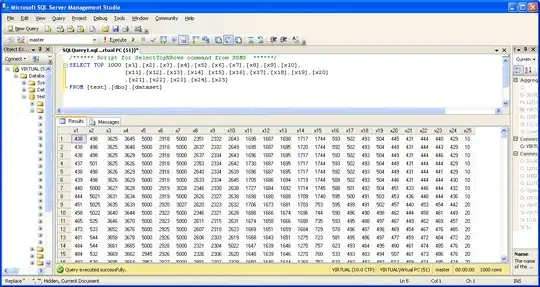
I have the following data frame:
For which I'm plotting a varchar using Seaborn:
ax = sns.barplot(x='Numero de respuestas', y='Carrera' ,

data=carrera_sum)
fig = ax.set_xlabel('Numero de respuestas')
On the notebook, it looks fine but when I try to save it:
fig = ax.get_figure()
fig.savefig(join(figuras,'carreras_comunes_latam.png'))
I get an incomplete image:


