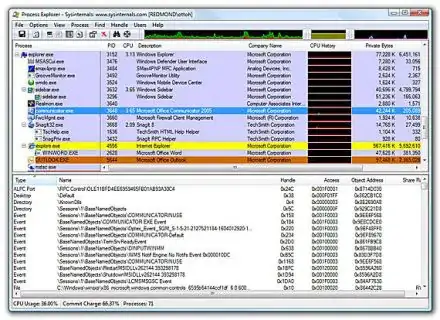
I understand there are many questions related to this, so I'll be very specific. I create Console application with two instructions. Create a List with some large capacity and fill it with sample data, and then clear that List or make it equal to null. What I want to know is if there is a way for me to know/measure/profile while debugging or not, if the actual memory used by the application after the list was cleared and null-ed is about the same as before the list was created and populated. I know for sure that the application has disposed of the information and the GC has finished collecting, but can I know for sure how much memory my application would consume after this? I understand that during the process of filling the list, a lot of memory is allocated and after it's been cleared that memory may become available to other process if it needs it, but is it possible to measure the real memory consumed by the application at the end? Thanks
Edit: OK, here is my real scenario and objective. I work on a WPF application that works with large amounts of data read through USB device. At some point, the application allocates about 700+ MB of memory to store all the List data, which it parses, analyzes and then writes to the filesystem. When I write the data to the filesystem, I clear all the Lists and dispose all collections that previously held the large data, so I can do another data processing. I want to know that I won't run into performance issues or eventually use up all memory. I'm fine with my program using a lot of memory, but I'm not fine with it using it all after few USB processings. How can I go around controlling this? Are memory or process profilers used in case like this? Simply using Task Manager, I see my application taking up 800 MB of memory, but after I clear the collections, the memory stays the same. I understand this won't go down unless windows needs it, so I was wondering if I can know for sure that the memory is cleared and free to be used (by my application or windows)
