Let
vetA <- structure(
  c(1L, 1L, 1L, 3L, 3L, 3L, 3L, 2L, 2L, 2L),
  .Label = c("Two", "One", "Three"),
  class = "factor"
)
vetB <- reorder(vetA, c(9,1,2,3,4,8,7,6,10,5))
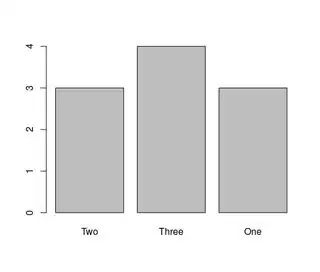
plot(vetA)
plot(vetB)
The plots show differently.
plot(VetA)
plot(VetB)
However, reading the ?reorder manual, I didn't understand how the function works and how to manipulated it, so I could display the bars in this order One Two Three. Also, I have read this post in which uses reorder. But,
it got me more confused because he used as a second argument a vector not with index, but with percent.
So, could you please have some mercy & give me a hand?

