This requires a lot of experience though. Below are some steps that you could follow:
Prerequisite:
You should understand java Memory Model i.e. what's New Generation(Eden, Survivor-01,Survivor-02), Old Generation, Meta Space, Heap, Stack etc.
Read this to understand it better.
You should understand how Garbage collection works. e.g. you should understand how Mark and Sweep algorithm works. Check the same link as above for same.
Now you could install visual VM. Also, in visual vm install a plugin visual gc it will show you memory used in different space. You will see another tab Visual GC
i) Observe Graphs(Heap one to top right in the snapshot below) in Monitor Tab.

**Trick: ** You could perform manual GC as well to observe how steep the graph line for Used Heap Space is and how quickly it fills up at running some block of code. I used it many times and it really helps (Especially if used with the debugger)!
ii) Also, try to observe the Thread Dump if multithreading is causing some issue.
iii) In any case, you could also do some profiling or sampling via profiler and sampler tab.
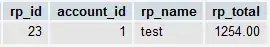
Below is a snapshot of sampler. See how clearly it tells how much memory is taken by what data type:
Important: Screenshot is of the heap. You could change to Per Thread Allocation tab to see per thread allocation.
Similarly, you could observe CPU consumption.
Alternatively, use JMeter if you think locally you are not able to reproduce the same. Jmeter can help you extensively load test your application basically.
Also, if you have integrated any server monitoring tool that could also be helpful. You could easily get notified for a problematic code.
At last, you could download the heap dump from the production system and analyze that on local using visual vm.
jmap -J-d64 -dump:format=b,file=<heap_dump_filename> <pid>
this link have more detailed answers from some really cool developers on same.
Use jstat. It comes with java and is very handy sometimes.
jstat -gc 2341 //2341 is the java process id.
These are from my experience. But In this direction, there would never be enough and I believe my knowledge keeps on evolving as I face more such issues. Hence, please practice it and explore further.
Having said that, there are other tools available so also feel free to find other ones that suit your needs well. To get started take a look at Jconsole.


